Data for liquids presented in this article suggest that global crude oil, natural gas liquids (NGL), and Alberta oil sands production will plateau at above 118 million b/d and productive capacity at 123 million b/d in 2031-far later than current alarmist predictions-even without the likely development of tar sands and other bitumens and extra-heavy crude.
Unfortunately there are no reliable data on total recoverable global natural gas resources and of cumulative production, which are required to estimate the time and quantity of peak gas production.
Nevertheless, the global natural gas outlook is also quite bright, with Jan. 1, 2006, proved reserves of 6,112 tcf, and total 2003 global consumption of 95.5 tcf rising to 182 tcf in 2030, according to the Energy Information Administration (EIA) Reference Case in its International Energy Outlook 2006. This is equivalent to a roughly 40-year gas reserve life. This outlook is especially positive, as global gas exploration and resources development have not been nearly as intensive as for crude oil.
In the US, however, current gas production of 19 tcf/year is already near its projected plateau, and a decline in domestic production seems inevitable unless there is a much more aggressive leasing policy, both off and onshore, especially for unconventional natural gas resources such as coalbed methane (CBM), tight sands gas, Devonian shale gas, and gas from ultradeep formations.
This article addresses both these two critical issues:
- The time and magnitude of peak global production of conventional petroleum liquids, such as crude oil and lease condensates, and oil from Alberta oil sands and NGL.
- The magnitude and time of peak US natural gas production.
World liquids resources
In addition to crude oil, lease condensate, and NGL, conventional petroleum liquids now include crude recovered from Alberta oil sands, which have been included in proved reserves since Jan. 1, 2003.1
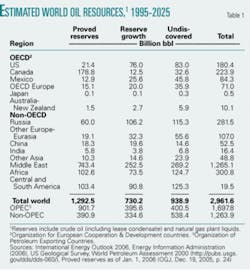
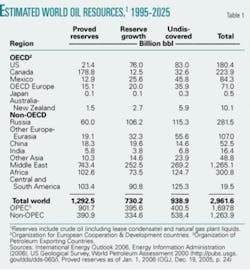
According to the International Energy Outlook 2006, as shown in Table 1, estimated proved and undiscovered world oil resources are 2,961.6 billion bbl, which includes 1,292.5 billion bbl of proved crude oil, lease condensate, and NGL reserves.2 The US Geological Survey’s estimates of reserve growth and undiscovered resources also include lease condensates and NGL. Worldwide, NGL production during the first 3 months of this year was 7.613 million b/d, or 10.3% of the total liquids production, in addition to 73.761 million b/d of crude oil production.3 4
In order to estimate the time of peak global oil or hydrocarbon liquids production, there must be a good estimate of cumulative production through 2005. This estimate would include unconventional sources such as the prolific Alberta oil sands that have made Canada the world’s No. 2 reserve holder after Saudi Arabia, with 178.8 billion bbl as of Jan. 1, 2006, out of the total 1,292.5 billion bbl proved reserves.5
The most reliable value is 986.496 billion bbl through Jan. 1, 2005, from the 61st edition of the DeGolyer and MacNaughton Twentieth Century Petroleum Statistics 2005.6 These data, for crude oil only, exclude NGL. Updating this value with an estimated global crude oil production of 71.794 million b/d in 2005 would add 26.205 billion bbl to the Jan. 1, 2005, value of 986.496 billion bbl for a total of 1,012.701 billion bbl.5
To estimate cumulative global petroleum liquids production through January 1, 2006, including NGL, the value of 1,012.701 billion bbl would have to be raised by 10.3% to 1,117.009 billion bbl on the basis of the admittedly sketchy data cited for 2006.
Using the widely questioned but very useful technique of M. King Hubbert in assuming that oil and gas production follows a sigmodial (logistic) curve with the area under the curve representing the total resource base, the estimated ultimate global recovery of petroleum liquids would be 4,078.6 billion bbl.7 These volumes consist of 2,961.6 billion bbl of estimated world oil resources as of Jan 1, 2006, and 1,117.0 billion bbl of cumulative production through 2005.
The author, in an earlier two-part OGJ article: “Rising expectations of ultimate oil, gas recovery to have critical impact on energy, environmental policy” published in the Jan. 19 and 26, 2004, issues, estimated that the total remaining recoverable resources of all petroleum liquids could be as high as 7,900 billion bbl.7 This amount excludes 3,500 billion bbl of shale oil but includes NGL and oil from oil and tar sands, other bitumens, and extraheavy crude. This is in agreement with a recent article in OGJ, “End of oil? No it’s a new day dawning,” by Mike Bohorich.8 The midpoint would then be 2,039.3 billion bbl. Deducting cumulative production of 1,117 billion bbl, leaves 922.3 billion bbl of remaining recoverable petroleum liquids, based on current technology and geological data.
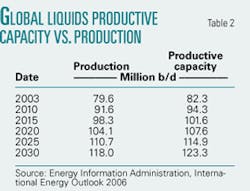
EIA, in its International Energy Outlook 2006 for the Reference Case, projects that world oil productive capacity will exceed production through 2030 (Table 2).9
This corresponds to an average production of about 100 million b/d, or 36.5 billion bbl/year. On this basis, peak production would not be reached for 25 years (922.3/36.5) i.e., Jan.1, 2031, at over 118 million b/d globally and well below productive capacity of 123 million b/d in 2030, far later than current alarmist predictions.
Furthermore, over this time span, nonconventional oil production from oil sands, bitumens, and extra-heavy crude will displace a great deal of existing global oil consumption. Alberta oil sands production alone is projected to reach 3 million b/d in 2015.10
Then, as widely reported in the media, on Sept. 5, 2006, Chevron Corp. announced a major crude oil discovery in the deep Gulf of Mexico in the Lower Tertiary trend with reserves that could be as high as 15 billion bbl.11
Cambridge Energy Research Associates forecasts that the deepwater area of the Gulf of Mexico will produce 800,000 b/d within 7 years. In addition, there are good prospects for biofuels, synthetic fuels from coal and oil shale, and conversion of surface transport to hydrogen proton exchange membrane (PEM) fuel cell propulsion using carbon-emission-free sources of hydrogen. The latter could be generated by the modified Integrated Coal Gasification Combined Cycle process in which raw synthesis gas produced by steam-oxygen pressure gasification of coal or lignite is processed with additional steam by catalytic water gas shift (CO + H2O → CO2 + H2) into more hydrogen and carbon dioxide, and the CO2 is removed and sequestered in suitable underground formations.12
Pollutants, primarily hydrogen sulfide, also are removed and used as a source of byproducts such as elemental sulfur. The logistics of distributing this hydrogen are still in question, but an intermediate step would be fully commercial catalytic natural gas reforming filling stations-admittedly with still a relatively small amount of CO2 emissions, but a substantial improvement over conventional internal combustion engines.
Biomass role questioned
Biomass or energy crops in general are most dubious as replacements for fossil fuels because of prohibitive land requirements, large labor and energy requirements in planting, cultivation, and harvesting such crops, and unacceptable environmental impacts.13
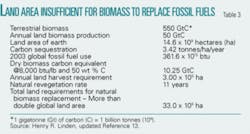
Reliance on biomass to replace a significant portion of fossil fuels would disturb the global carbon cycle of the 200 gigatonnes (1 Gt =1 billion tonnes) of carbon that circulate in the form of CO2 annually between terrestrial sources and sinks, the surface and deep ocean, and the atmosphere.14 All numerical values used here cite only the carbon content as a surrogate for the CO2, which, in turn, is used as a surrogate for all anthropogenic greenhouse gases.
The ocean absorbs 92 Gt/year of CO2. Of this amount, 90 Gt/year move from the surface of the ocean to the atmosphere, so the ocean naturally sequesters 2 Gt/year.
Another 100 Gt/year of carbon are fixed by photosynthesis, of which 50 Gt are lost from the 550 Gt inventory of land biota to the soil and detritus that emits 50 Gt/year from decomposition. Because 50 Gt are returned by plant respiration, 50 Gt are left to naturally revegetate the land biomass, at a revegetation rate of 11 years (550/50 = 11).
There also is 2 Gt/year of natural carbon sequestration largely due to Northern Hemisphere afforestation of the 8 Gt/year of anthropogenic emissions from fossil fuel combustion and cement production and continuing tropical deforestation. Thus, total natural carbon sequestration currently is about 4 Gt/year. Any large use of biomass as a substitute for fossil fuels could disrupt this natural carbon cycle. It would also take more than twice the land area of the Earth to produce enough biomass to replace the energy content of current fossil fuel use by natural revegatation (Table 3).
Of course, substantial additional amounts of biomass would be required to convert the large portion of the total to liquid and gaseous fuels. Proposals to use corn stalks or sugar cane stalks as a source of cellulosic ethanol would destroy the fertility of the soils, which requires that the organic matter and nutrients in these materials be returned and plowed under. The basic problem is the inefficiency of photosynthesis, which is 100 times lower than the efficiency of photovoltaic power.
Thus, the solution to our energy problems is not regression to the use of fuel wood, etc., but technology. This is why the “hydrogen economy” based on photovoltaic power and PEM electrolysis and hydrogen storage, as well as nuclear, wind, and hydroelectric power, where available, are the much-preferred alternatives.
The basic problem with intermittent photovoltaic and wind power is, of course, their intermittency, although there are means to store excess energy.
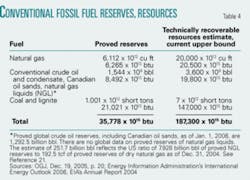
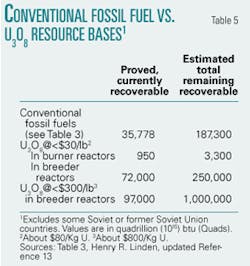
Unfortunately, because of limited uranium resources at acceptable costs, even nuclear power is not sustainable, but it can be a source of emission-free power supply during the transition period. However, development of breeder reactors would triple to more than quintuple the energy content of fossil fuel reserves and recoverable resources (Tables 4 and 5).
Unconventional resources
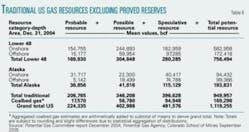
There are no global data on natural gas resources equivalent to oil resources. However, there are comprehensive data on the US natural gas resource base, thanks to the Potential Gas Committee.15 As shown in Table 6, the Dec. 31, 2004, estimate of probable, possible and speculative resources, including CBM, is 1,199.255 tcf for the Lower 48 and Alaska. Proved reserves as of Dec. 31, 2004 were 192.5 tcf. However, the US supply outlook is not encouraging at a US production of 19 tcf/year, leaving only about 7 years before US gas production as currently practiced would peak.
In recent months there has been a shift in sentiment about the outlook for US natural gas supplies. This shift has been reflected in a decline in the level of NYMEX Natural Gas Futures from over $8/million btu in March to $6-6.50/million btu in late May and early June and to below $6/million btu in early September.
There was, however, a temporary run-up to about $7/million btu in late June and to over $8/million btu in early August. This was the result of worries about the beginning of the tropical storm season and the unusual heat wave in much of the US that reduced the working gas storage reinjection rate somewhat to below the 5-year average. Storage was still well above the 51.4 bcf/week required to completely fill working gas storage to 3.4 tcf by the end of October.16
However, this positive outlook then suffered a setback, with rapidly declining reinjection rates and, apparently, small premature drawdowns in July and August 2006.17 18 19 Surprisingly, NYMEX futures held at $6.50-7.00/million btu in much of August but started rising again in late August before dropping to as low as $4.50/million btu in late September and early October as the working gas storage outlook greatly improved to a possible record of 3.5 tcf at the start of the withdrawal season Nov.1. This gas price volatility is expected to continue as indicated by a rise of NYMEX futures to about $7.50/million btu at the end of October.
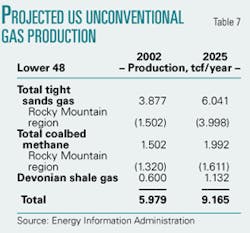
One of the major positive impacts on gas prices is that there is growing optimism about the potential of unconventional gas, such as gas from tight formations, Devonian shales, geopressured reservoirs, coal beds, and extremely deep horizons. Of highest probability is that technology advances can increase the production of three sources of unconventional gas above the levels projected by EIA through 2025 (Table 7).20
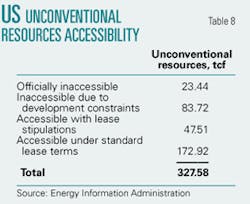
The Rocky Mountain region is by far the largest source of CBM and tight sands gas but much of the underdeveloped resources of unconventional gas are inaccessible (Table 8).21
Total US CBM proved reserves as of Dec. 31, 2004, were 18.390 tcf, according to EIA, and 2004 production was 1.720 tcf.21 In view of the huge US coal resource base, the research, development, and demonstration (RD&D) programs to enhance the technology for CBM discovery, development, and production seems especially promising, including the use of CO2 destined for sequestration to stimulate production. For example, as shown in Table 6, the Potential Gas Committee in its estimated potential US gas resources, December 2004, projects the probable US resource of CBM at roughly 18 tcf, the possible resource at 57 tcf, the speculative resource at 95 tcf, and the total potential resource at 169 tcf, now a relatively conservative estimate.
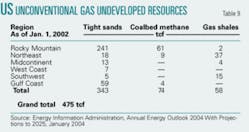
One of the first priorities should be to obtain a more reliable estimate of technically recoverable Lower 48 unconventional natural gas resources. The Potential Gas Committee of the Colorado School of Mines’ Potential Gas Agency, the Department of Energy’s Office of Oil and Gas, and DOE’s EIA in its Annual Energy Outlook series, all produced widely differing values. For example, in the EIA Annual Energy Outlook 2004 (January 2004), the technically recoverable Lower 48 unconventional natural gas resources as of Jan. 1, 2002, are given as 475 tcf, including 343 tcf tight gas, 58 tcf shale gas, and 74 tcf CBM (Table 9)22 compared with 184.1 tcf of Lower 48 proved conventional gas reserves on Dec. 31, 2004, reported by EIA in its “2004 Annual Report of US Crude Oil, Natural Gas and Natural Gas Liquids Reserves.”23
An article by Sam Fletcher, “Major US supply role seen for unconventional gas,” extensively quotes Scott R. Reeves, a well-known authority on this subject, from an earlier conference in Houston and gives a good history of the development of unconventional gas.24 In particular, it covers CBM from the early 1980s to the early 1990s as a major supply source thanks to Section 29 federal tax credits and research by DOE and the Gas Research Institute (GRI). Yet, according to Reeves, the US will still see tremendous production growth. He is especially optimistic about CBM, whose development was nearly entirely the result of GRI’s RD&D investments and which should offer additional opportunities to the new Gas Technology Institute (GTI) formed by the merger of GRI and the Institute of Gas Technology in 2000. Reeves makes many useful suggestions on enhanced CBM production technologies and promising areas for exploration and notes that the Green River basin alone contains a resource base of 314 tcf of CBM.
Methane hydrates
Methane hydrates have tremendous potential.25 In fact, more than half of all the organic carbon on Earth (recoverable and nonrecoverable fossil fuels, soil, dissolved organic matter, land biota and peat) is in the form of marine and permafrost methane hydrate deposits. This is equivalent to 706,000 tcf of methane, of which 112,000-113,000 tcf is in US coastal deposits and a small permafrost deposit at 95% probability. About 100,000 tcf of methane would meet total current US energy consumption of about 100 quadrillion (1015) btu for 1,000 years. However, the current development initiatives seem to remain focused on the more “conventional” forms of unconventional natural gas, especially CBM.
US gas peak production
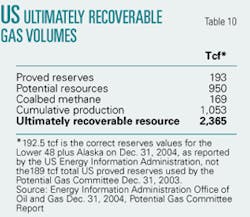
As shown in Table 6, the Potential Gas Committee of Colorado School of Mines, Potential Gas Agency, in its biannual estimates of total US potential gas resources arrived at a Dec. 31, 2004, mean value of 1,119.255 tcf, including CBM, but excluding proved reserves.15 They also updated cumulative production to 1,053 tcf.26 Adding Dec.31, 2004, proved reserves of 192.5 tcf for the US, including Alaska, results in a total original resource of 2,365 tcf (Table 10).15
Assuming a symmetrical bell-shaped (logistic) curve of annual production as Hubbert proposed,7 with the area under the curve representing ultimately recoverable resources, the peak production would be reached at the midpoint of cumulative production, or 2,365/2 = 1,183 tcf. Less 1,053 tcf cumulative production as of Dec. 31, 2004, leaves only 130 tcf of cumulative production before annual production declines.
At the current annual US natural gas production of 19 tcf/year,27 there would remain only 7 years before US natural gas production would plateau. This technique of projecting peak production in a given producing area is highly questionable because it does not take into account technology advances, such as increased CBM and new methane hydrate production, nor does it reflect the new, more-liberal state and federal leasing policies for offshore conventional gas production.
New technology impact
Convincing proof that technological development can dramatically increase proved hydrocarbon fuel reserves can be found in the catapulting of Canada from having 5 billion bbl of crude oil reserves-putting it at the low end of the world’s crude oil and condensate reserve holders-to 180 billion bbl on Jan. 1, 2003. This advanced Canada to No. 2, after Saudi Arabia, with 259 billion bbl Jan. 1, 2003, and to 264 billion bbl in January of this year. This was due to recoverable bitumen in Alberta’s oil sands’ being accepted for inclusion as a refinable source of petroleum liquids in 2003, thanks to technology advances.1
This ranking has held roughly steady through Jan. 1 of this year, with Iran and Iraq vying for No. 3 and 4 at 132 billion bbl and 115 billion bbl, respectively. In addition, OPEC’s share of global crude oil and condensate reserves dropped by this single development from 79.4% on Jan. 1, 2002, to 67.5% on Jan. 1, 2003, and 69.8% in Jan. 1 of this year. For comparison, US proved crude oil reserves on that date were 21.4 billion bbl. With all the large global resources of oil and tar sands and other bitumens, such as the Athabasca tar sands in Alberta and Orimulsion in Venezuela’s Orinoco tar belt, further extensions of the competitive liquid petroleum fuels resource base can be expected. The heavy oil product Orimulsion is used as substitute for residual fuel oil.
There is no reason why similar revolutionary technology advances cannot dramatically increase the global proved gas reserves of 6,112.1 tcf on Jan. 1 of this year, especially if the industry successfully pursues partial development of US and Japanese methane hydrate resources.5
Acknowledgment
The author gratefully acknowledges the support of the Illinois Institute of Technology, Department of Chemical and Environmental Engineering, and of Gas Technology Institute for much of the underlying research for this article.
References
- OGJ, Dec. 23, 2002, p. 113.
- International Energy Outlook 2006, Energy Information Administration, June 2006.
- OGJ, July 3, 2006, p. 71.
- US Department of Energy, Energy Information Administration, Monthly Energy Review, June 2006, p. 151.
- OGJ, Dec. 19, 2005, p. 20.
- Twentieth Century Petroleum Statistics 2005, p. 12, DeGolyer and MacNaughton, 501 Spring Valley Road, Suite 800 East, Dallas, Tex. 75244.
- Linden, H. R., “Rising expectations of ultimate oil, gas recovery to have critical impact on energy, environmental policy - Part 1,” (OGJ, Jan. 19, 2004, p. 18); Part 2, (OGJ, Jan. 26, 2004, p.18).
- OGJ, Aug. 21, 2006, p.30.
- International Energy Outlook 2006, Energy Information Administration, June 2006, Document No. DOE/EIA-0484 (2006), Table E4, p. 158 and Table E1, p. 155.
- OGJ, June 12, 2006, p. 5.
- OGJ, Sept. 11, 2006, p. 17.
- “Evaluation of Innovative Fossil Fuel Power Plants with CO2 Removal,” Electric Power Research Institute, Palo Alto, Calif.; US Department of Energy, Office of Fossil Energy, Germantown, Md.; and National Energy Technology Laboratory, Pittsburgh, Pa., Interim Report, Document No.1000316, December 2000. Prepared by Parsons Energy Group Inc. and Wolk Integrated Technical Services.
- Linden, H.R., “Let’s Focus on Sustainability, Not Kyoto,” The Electricity Journal, Vol. 12, No. 2, March 1999, pp. 56-67.
- Houghton, J.T., et al., Eds., “Climate Change 1995: The Science of Climate Change,” Contribution of Working Group 1 to the Second Assessment Report of the Intergovernmental Panel on Climate Change; Cambridge University Press: Cambridge, UK and New York, 1996.
- “Potential Gas Supply of Natural Gas in the United States,” Report of the Potential Gas Committee Dec. 31, 2004, Potential Gas Agency, Colorado School of Mines, September 2005.
- Natural Gas Week, Vol. 22, No. 24, June 12, 2006, pp. 1,7,14.
- Natural Gas Week, Vol. 22, No. 31, July 31, 2006, p. 5.
- Natural Gas Week, Vol. 22, No. 32, Aug. 7, 2006, p. 7.
- Natural Gas Week, Vol. 22, No. 33, Aug. 14, 2006, p. 5.
- “Annual Energy Outlook 2004 With Projections to 2025,” Energy Information Administration, Office of Integrated Analysis and Forecasting, US Department of Energy, January 2004, Document No. DOE/EIA-0383 (2004), pp. 37-38.
- US Crude Oil, Natural Gas, and Natural Gas Liquids Reserves 2004 Annual Report, Energy Information Administration, Office of Oil and Gas, US Department of Energy, November 2005, Document No. DOE/EIA-0216 (2005), p. 38.
- Annual Energy Outlook 2004 With Projections to 2025,” Energy Information Administration, Office of Integrated Analysis and Forecasting, US Department of Energy, January 2004, Document No. DOE/EIA-0383 (2004), p. 36.
- US Crude Oil, Natural Gas, and Natural Gas Liquids Reserves 2004, Op. cit. p. 30.
- OGJ, Dec. 20, 2004, p. 32.
- Linden, H.R., “Reversing The Gas Crisis, The Methane Hydrate Solution,” Public Utilities Fortnightly, Vol. 143, No. 1, January 2005, pp. 34-41.
- “Potential Gas Supply of Natural Gas in the United States,” Report of the Potential Gas Committee Dec. 31, 2004, Potential Gas Agency, Colorado School of Mines, September 2005, Table 5, p. 6.
- “US Crude Oil, Natural Gas, and Natural Gas Liquids Reserves,” 2004 Annual Report, Energy Information Administration, Office of Oil and Gas, US Department of Energy, November 2005, Document No. DOE/EIA-0216 (2005), p. 4.
The author
Henry R. Linden is Max McGraw Professor of Energy and Power Engineering and Management and director of the Energy & Power Center at the Illinois Institute of Technology, Chicago. He has been a member of the IIT faculty since 1954 and served as IIT’s interim president and CEO during 1989-90, as well as interim chairman and CEO of IIT Research Institute. Linden helped to organize the Gas Research Institute (GRI), the US gas industry’s cooperative research and development arm that merged with the Institute of Gas Technology (IGT) in 2000 to form Gas Technology Institute. He served as interim GRI president in 1976-77 and became the organization’s first elected president in 1977. Linden retired from the GRI presidency in April 1987 but continued to serve the group as an executive advisor and member of the advisory council. From 1947 until GRI went into full operation in 1978, he served IGT in various management capacities, including 4 years as president and trustee. Linden also served on the boards of five major corporations for extended terms during 1974-98. He worked with Mobil Oil Corp. after receiving a BS in chemical engineering from Georgia Institute of Technology in 1944. He received a master’s degree in chemical engineering from the Polytechnic Institute of Brooklyn (now Polytechnic University) in 1947 and a PhD in chemical engineering from IIT in 1952.
