Since January 2006, US gas plants have enjoyed record high profit margins. Furthermore, propane prices in all regional markets have been strong enough to encourage refineries to maximize sales into the merchant market.
Despite these economic incentives, gas-plant production (even after adjusting for ongoing problems in Louisiana) and net production from refineries failed to reach their historic full-recovery volumes.
During 2000-02, US producers and consumers could count on 900,000-925,000 b/d propane production from gas plants and refineries, when gas plants operated at full recovery. Since 2002, however, “full recovery” gradually declined but the decline went largely unnoticed because a variety of economic and weather-related factors held production below the historic full-recovery volumes.
Propane supply
Before 2005, full propane production (gas-plant production plus net refinery production) for the US was estimated at 900,000-925,000 b/d. Propane production in the US was in this range about 75% of the time during 2000-02.
Propane production has not averaged 900,000 b/d or more since second-quarter 2002. During 2003-05, full-recovery production declined and is now estimated to be 850,000-875,000 b/d.
Total propane production averaged 803,000 b/d in second-quarter 2006 and was an estimated 805,000-815,000 b/d in third-quarter 2006.
Gas plants
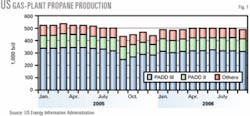
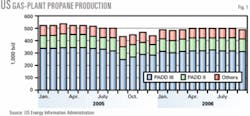
Historically, at full recovery, gas-plant production would normally average 545,000-560,000 b/d. In second-quarter 2006, however, propane production from gas plants averaged only 501,000 b/d, or 45,000-60,000 b/d below full recovery. Production in second-quarter 2006 increased 13,000 b/d from first-quarter 2006 but was 22,000 b/d lower than year-earlier volumes.
Although production in Louisiana had not recovered from losses due to Hurricane Katrina, these losses had narrowed to about 20,000 b/d in second-quarter 2006. Gas-plant production in third-quarter 2006 was an estimated 500,000-515,000 b/d-again below demonstrated historic full-recovery production.
US Energy Information Administration (EIA) statistics for Petroleum Administration for Defense District (PADD) III provide details for five subregions. Gas-plant propane production in the Texas Gulf Coast subregion (Texas Railroad Districts 1, 2, and 3) averaged only 30,000-32,000 b/d during 2003 through second-quarter of 2006, or 12,000-14,000 b/d lower than the historic peak of 44,000 b/d (first-quarter 2000).
Similarly, gas-plant production in PADD IV (Rocky Mountains) averaged only 55,000-57,000 b/d during first and second quarters 2006 vs. the historic maximum of 64,000 b/d (first-quarter 2003).
The decline in full-recovery production in these two regions reduced the gas processing industry’s full-recovery production by about 20,000 b/d.
Based on the emerging trend, we forecast gas-plant production to average 495,000-505,000 b/d during fourth-quarter 2006 and 530,000-540,000 b/ d during first-quarter 2007. The forecast accounts for the Louisiana gas processing industry’s continued recovery.
Fig. 1 illustrates trends in propane production from gas plants.
Refineries
Historically, full-recovery propane production from refineries was about 370,000-380,000 b/d. Net production from refineries was most recently at this level in second-quarter 2001. Since 2001, however, net production from refineries has never been higher than 340,000-360,000 b/d and was most recently at this level in second-quarter 2005.
In second-quarter 2006, net propane production from refineries averaged only 301,000 b/d-despite very strong economic incentives to maximize purchases of natural gas and minimize the use of propane in refinery fuel systems. Notably, net propane production from refineries in PADD I and PADD III failed to rebound to historic full-recovery volumes in second-quarter 2006.
Production in PADD I in the second-quarter 2006 averaged only 26,000 b/d and was 7,000 b/d below year-earlier volumes. Production in PADD III in second-quarter 2006 averaged only 144,000 b/d and was 32,000 b/d lower than year-earlier volumes.
Fuel switching
Net propane production from refineries in PADD I typically averaged 30-35,000 b/d before the surge in natural gas prices in fourth-quarter 2005. Net propane production declined to 25,000 b/d in fourth-quarter 2005 and averaged only 22,000 b/d in the first-quarter 2006.
In second-quarter 2006, however, net propane production increased to 26,000 b/d. Refineries in PADD I experienced the full impact of the sharp spike in natural gas prices following Hurricane Katrina and were logical candidates for fuel switching. The decline in merchant sales of propane from refineries in PADD I was fully reasonable.
Furthermore, a lag of 3-6 months is also reasonable before the effects of fuel switching and adjustments to refinery fuel systems are fully reversed. Net propane production from refineries in PADD I is likely to be 5,000-10,000 b/d higher in fourth-quarter 2006 compared with fourth-quarter 2005.
Net propane production from refineries in PADD III typically averaged 165,000-175,000 b/d before fourth-quarter 2005. In first-quarter 2006, net propane production averaged only 132,000 b/d but increased to 144,000 b/d in second-quarter 2006. Even though almost every refinery in PADD III had returned to full production and normal operations, net propane production remained 20,000-30,000 b/d below prehurricane levels.
The average net production in second-quarter 2006, however, was skewed by an unusual decline in June. In April and May 2006, net production in PADD III averaged 154,000 b/d, or only 10,000-20,000 b/d below prehurricane volumes. Net propane production will continue to recover to full prehurricane volumes during third and fourth quarters 2006.
Heating-season outlook
We expect propane supply from refineries to average 300,000-320,000 b/d in fourth-quarter 2006 and 325,000-350,000 b/d in first-quarter 2007. Recovery and reversal of fuel switching could occur faster and net propane production in fourth-quarter 2006 may be as high as 330,000-340,000 b/d.
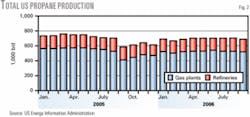
Fig. 2 illustrates trends in total propane production (gas plants and refineries).
Imports
In second-quarter 2006, total propane imports into the US averaged 204,000 b/d. Imports were 22,000 b/d higher than in second-quarter 2005 but were 15,000 b/d lower than in first-quarter 2006. The decline in imports in second-quarter 2006 was consistent with normal seasonal trends.
Significantly, waterborne shipments to terminals on the East Coast and Gulf Coast posted a year-to-year increase of 32,000 b/d in second-quarter 2006, but shipments from Canada declined by 10,000 b/d.
Imports into the US during third-quarter 2006 were an estimated 200,000-210,000 b/d, or about the same as in 2005. Based on normal seasonal patterns, total imports into the US will increase to 210,000-220,000 b/d in fourth-quarter 2006 and 220,000-230,000 b/d in first-quarter 2007.
Imports in fourth-quarter 2006 will be about 115,000-125,000 b/d lower than in fourth-quarter 2005. The surge of waterborne shipments in the aftermath of hurricanes Katrina and Rita pushed the volume of imports in fourth-quarter 2005 abnormally high.
Overall trends
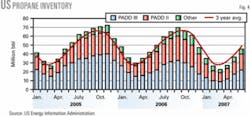
Apr. 1 marks the beginning of the inventory accumulation season for US. Inventories in primary storage increased by 19.7 million bbl during second-quarter 2006, an increase equal to the historic average but 6.1 million bbl less than in second-quarter 2005.
Based on weekly reports from EIA, propane inventories increased by 20 million bbl during third-quarter 2006.
The increase in inventories during second and third quarters 2006 totaled 39-40 million bbl. The total increase in inventories was about 2 million bbl higher than the historic average but was 2 million bbl lower than in 2005.
Because inventories on Apr. 1 were almost 3 million bbl higher than year-earlier levels, this year’s inventory level on Oct. 1 will be equal to the year-earlier level. In 2005, however, inventories continued to build through November and into early December due to the surge in waterborne imports.
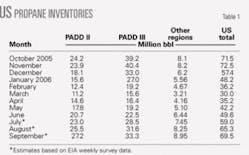
This year, inventories will follow normal seasonal patterns. This year’s peak of 70 million bbl was about 2 million bbl lower than the peak of 72.5 million bbl in 2005 (Table 1).
During a typical winter, propane markets withdraw 40-44 million bbl of inventory from primary storage. With 70 million bbl of propane in primary storage, a normal inventory withdrawal during the winter heating season will reduce product in storage to about 26-30 million bbl on Apr. 1, 2007. Typically, inventories decline to a seasonal minimum of 26-27 million bbl.
Fig. 3 illustrates trends in propane inventory.
Regional inventory trends
Propane inventory in primary storage in PADD II totaled 11.2 million bbl at the end of March 2006. Inventory in PADD II was 2.3 million bbl higher than the 3-year average and 2.7 million bbl higher than at the end of March 2005. By the end of September 2006, inventory in primary storage in PADD II had increased to a peak of about 26 million bbl. Inventory in PADD II on Oct. 1 was 2.2 million bbl higher than the 3-year average and almost 3 million bbl higher than on Oct. 1, 2005.
Based on normal withdrawals of supply from primary storage (16-18 million bbl) during the winter heating season, inventory in PADD II will decline to a seasonal low of 9-11 million bbl at the end of March 2007.
Propane inventory in primary storage in PADD III totaled 15.5 million bbl at the end of March 2006 and was 0.4 million bbl higher than the 3-year average but 0.4 million bbl lower than in 2005. The inventory build during second-quarter 2006 totaled only 7 million bbl and was unusually weak compared with the 3-year average of 11.5 million bbl.
During third-quarter 2006, the inventory build totaled about 11 million bbl compared with the 3-year average of 9 million bbl. On Oct. 1, inventory in primary storage in PADD II had reached a peak of 36 million bbl. The 2006 peak for PADD III was 2.6 million bbl lower than in 2005. Furthermore, inventories in PADD III in 2005 continued to build during October and November. Unless inventories continue to increase during November, the 2006 inventory peak was about 4 million bbl lower than in 2005.
From a seasonal low of 4.5 million bbl at the end of March 2006, propane inventories in Canada increased by 6.2 million bbl. The increase during the second quarter was about equal to the 5-year average but was 2.4 million bbl more than in 2005. Inventories in Canada continued to build during the third quarter and reached a peak of 14 million bbl on Oct. 1. The 2006 inventory peak in Canada was 3.4 million bbl higher than in 2005 and 0.7 million bbl higher than the 5-year average.
Propane consumption
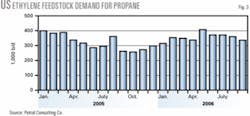
Ethylene producers have the demonstrated capability to swing feedstock demand for propane to a high of 425,000 b/d from a low of 200,000 b/d. The ethylene industry’s feedstock flexibility helps counterbalance the seasonality of propane consumption in the residential-commercial sector.
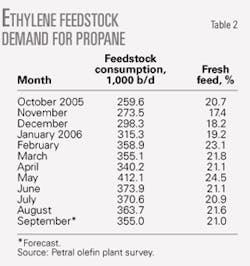
During second-quarter 2006, feedstock demand for propane averaged 375,000 b/d and propane’s share of fresh feed averaged 22%. During second-quarter 2006, propane’s share of fresh feed reached a record high of 24.5% (May). Feedstock demand for propane had not averaged 370,000 b/d or more since second-quarter 1999, and propane’s share of total fresh feed in second-quarter 1999 was 22.3%. During 1996-2005, propane’s share of fresh feed was equal to or exceeded 23% only 6.7% of the time.
In third-quarter 2006, feedstock demand for propane was 360,000-370,000 b/d and propane’s share of total fresh feed was 21- 22% (Table 2).
Ethylene plants will operate at 88-92% of capacity rates during fourth-quarter 2006 and first-quarter 2007. Total feedstock demand will average 1.65-1.75 million b/d. On the basis of the strong seasonal pattern in feedstock demand, propane consumption in the ethylene-feedstock market will average 300,000-325,000 b/d in fourth-quarter 2006 and 325,000-350,000 b/d in first-quarter 2007. Fig. 4 illustrates historic trends in ethylene feedstock demand.
Retail demand
Retail propane end uses include sales to residential-commercial, motor fuel, agriculture, and industrial sectors. Consumption in the residential-commercial sector usually accounts for 50-70% of total retail demand during second and third quarters and 70-80% of total retail demand during the winter heating season. Sales into the various retail end-use sectors are determined annually by the American Petroleum Institute on the industry’s behalf. Petral Consulting Co. used heating-degree-day statistics to develop estimates of monthly consumption in the residential-commercial and agriculture sectors.
Propane demand in the residential-commercial sector (space heating, cooking, and water heating) tracked normal seasonal patterns and declined during second and third-quarter 2006. Demand averaged 270,000-300,000 b/d in second-quarter 2006 and 100,000-115,000 b/d in third-quarter 2006. These volumes represent actual propane consumption, not 100% of retail sales.
In addition to estimated consumption, a small percentage of customers in the residential-commercial sector began to refill their storage tanks in May. More customers in the residential-commercial sector began to refill their storage tanks during third-quarter 2006. The estimated transfers of propane to secondary or tertiary storage averaged 200,000-225,000 b/d during third-quarter 2006. Propane transfers into secondary or tertiary storage during third-quarter 2006 were 40,000-150,000 b/d below volumes transferred to secondary or tertiary storage during 2001-05.
Based on estimated actual consumption in the residential-commercial sector and consumption in the motor fuel, agriculture, and industrial sectors, propane sales into retail end-use markets averaged 350,000-375,000 b/d in second-quarter 2006 and 150,000-175,000 b/d in third-quarter 2006.
Including transfers to secondary or tertiary storage, total propane sales into the retail markets were 350,000-400,000 b/d in third-quarter 2006. In 2005, total retail propane sales plus transfers to secondary or tertiary storage averaged 490,000 b/d.
Residential-commercial propane demand began to increase during September-October and will reach peak consumption during December-January. Based on average heating-degree days for the previous 10 years, residential-commercial propane consumption in all retail end uses will be 750,000-800,000 b/d in fourth-quarter 2006 and 975,000-1.1 million b/d in first-quarter 2007. Residential-commercial demand will average 1.1-1.2 million b/d during December through February.
Total propane demand in all retail end-use sectors will average 925,000-975,000 b/d during fourth-quarter 2006 and 1.2-1.3 million b/d during first-quarter 2007. Forecasts for retail propane demand during winter 2006-07 are 50,000-100,000 b/d higher than in the winter 2005-06. During winter 2005-06, heating-degree days in the East Coast and Midcontinent were 6-7% below the 1994-2004 average. Forecasts are based on the 10-year average number of heating-degree days.
Pricing, economics
Propane prices in Mont Belvieu averaged 93.2¢/gal in March 2006. During second-quarter 2006, Mont Belvieu prices rode the coattails of the strong rally in WTI prices. Spot propane prices increased to 109.7¢/gal in June, or 17.8% higher than in March. Propane prices in Mont Belvieu rose to 116.3¢/gal in July but declined to 113.7¢/gal in August and 103¢/gal in September.
During second-quarter 2006, the ratio of propane to WTI averaged 62.8%. The propane-WTI ratio during 2002-04 averaged 70.8% during second and third quarters. This comparison indicates that propane prices were weaker during second and third-quarter 2006 vs. the historic average. The propane-WTI ratio was also weaker than in second-quarter 2005. In third-quarter 2006, the propane-WTI ratio increased to 66.2%-still weaker than the historic average but stronger than in third-quarter 2005 (64.6%).
From the perspective of influences on supply-demand balances, ethylene feedstock price-value relationships are more important than WTI price ratios. In the second quarter, propane prices in Mont Belvieu averaged only 0.8¢/gal less than average substitution values vs. ethane and natural gasoline.
In third-quarter 2006, propane prices in Mont Belvieu averaged 3.3¢/gal higher than average substitution values vs. ethane and natural gasoline. These comparisons indicate that propane in Mont Belvieu was fairly priced in second-quarter 2006. Prices in the third-quarter 2006 were somewhat stronger but remained within the normal variability in price-value relationships.
Spot prices, 2006-07 heating season
WTI prices will average $58-62/bbl during fourth-quarter 2006. Spot propane prices in Mont Belvieu will average 94-102¢/gal during fourth-quarter 2006-or 68-70% of WTI. Spot propane prices in Mont Belvieu will increase to 100-110¢/gal during January and February 2007 but will decline to 95-100¢/gal in March-if WTI prices rebound from the fourth-quarter 2006 slump.
In the ethylene feedstock market, trends in propane’s feedstock parity value vs. ethane will be a much more bullish influence than was true in fourth-quarter 2005 and first-quarter 2006. In particular, ethane inventories are much tighter than they were during fourth-quarter 2005. Spot ethane prices in Mont Belvieu will be relatively strong during fourth-quarter 2005. The expected strength in ethane prices will have a bullish influence on spot propane prices in Mont Belvieu during fourth-quarter 2006. Taking this factor into consideration, spot propane prices in Mont Belvieu may be as high as 105-110¢/gal during fourth-quarter 2006 and first-quarter 2007.
Finally, there are emerging indications that the 3-year rally in WTI prices has run its course. WTI may continue to decline in fourth-quarter 2006 (to $55-58/bbl). In a more bearish crude oil price environment, propane prices in Mont Belvieu during fourth-quarter 2006 are likely to average 88-92¢/gal during fourth-quarter 2006 and first-quarter 2007.
The author
Daniel L. Lippe (danlippe@ petral.com) is president of Petral-Worldwide Inc., Houston. He founded Petral Consulting Co. in 1988. He has expertise in economic analysis of a broad spectrum of petroleum products including crude oil and refined products, natural gas, natural gas liquids, other ethylene feedstocks, and primary petrochemicals. Lippe began his professional career in 1974 with Diamond Shamrock Chemical Co., moved into professional consulting in 1979, and has served petroleum, midstream, and petrochemical industry clients since that time. He holds a BS (1974) in chemical engineering from Texas A&M University and an MBA (1981) from Houston Baptist University. He is an active member of the Gas Processors Association, serving on the NGL Market Information Committee and currently serving as vice-chairman of the committee.
