SPECIAL REPORT: Risk-based driving plan lowers accident losses
A site-specific, risk-based improvement plan for driving lowered the automotive accidents rates and associated losses for a service company’s Qatar oil field operations.
In the first 2 years of the plan, all performance indicators including the automotive accident rate and associated losses were the lowest in the past 4 years.
Problem identification
Driving accidents are a leading cause of fatalities in the oil and gas industry. Industry approaches to driving-accident prevention traditionally have involved policies and standards, defensive driving training, maintenance systems, journey management procedures, and performance monitoring.
Mitigation measures generally have focused on seat-belt use, vehicle condition, rollover-protection devices, air bags, braking systems, and emergency response plans. These measures usually control risk until the program reaches a performance plateau level.
To move toward zero-loss from vehicular events, management must critically analyze risk factors of a specific location and tailor plans further to reduce risk to acceptable levels.
Key to the site-specific plan addresses the attitude of the drivers. Experience has proven the value of generic preventive and mitigation measures. In the Qatar oil field operation, however, traditional risk-prevention measures were ineffective for controlling driving risk and achieving zero-loss performance. Several crashes and high-potential accidents occurred during a short time period.
In this particular case, even with the main requirements of the company’s driving standard implemented, the location’s performance was unacceptable to local management.
Driving performance indicators typically relate the number of accidents normalized by distance driven or the number of vehicles or drivers. The industry widely uses the automotive accident (or crash) rate in miles (AARm), which this study also uses.
AARm = No. of accidents/1 million miles driven
This indicator measures all accidents, or crashes, including those with high severity classified as catastrophic, major, or serious (CMS) and may include also the ones classified as light (L). The miles driven are usually the cumulative running average of the previous 12 months to represent trends better.
At this location, driving performance had deteriorated between January 2003 and September 2004, resulting in 2 major and 4 serious automotive accidents, as well as 9 and 21 light crashes in 2003 and the first three quarters of 2004, respectively.
Fortunately, no catastrophic events or personal injuries resulted from these accidents because of the previously described mitigation measures in place, along with low speeds controlled by driving monitors.
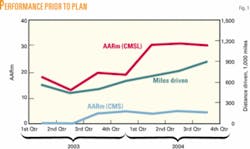
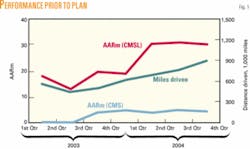
The area had a concurrent and dramatic increase in miles driven mainly attributed to growing activity levels. The miles driven had increased with a 2003 average of 600,000 miles/year increasing to 1.1 million in third-quarter 2004 (Fig. 1). About five serious or major crashes/million miles driven occurred, which increased to nearly 30 crashes/million miles when including light crashes.
Worldwide experience has shown that whenever a location is facing this trend, the probability of having a fatality increases considerably unless management takes steps to control the root causes.
The unacceptable performance coupled with the exposure increase represented a challenge. Schlumberger’s local management realized that, despite the preventive measures in place, the risk associated with driving was not controlled fully and that they had to carry out a proper root-cause analysis and devise an effective remedial work plan.
Management assigned a loss-prevention team to prepare a risk-based improvement plan to seek innovative solutions while taking into account both operational and personal needs better to ensure long-term sustained improvement. The loss-prevention team was a representative employee group whose focus was to:
- Assess the initial risk.
- Create a set of driver considerations.
- Identify common root causes.
- Generate a proposal for an action plan.
- Assess the residual risk to verify effectiveness.
Initial risk assessment
The risk-based improvement plan began with an initial risk assessment based on the location’s crash history (frequency and severity) and the risk-control measures in place at the time. The loss-prevention team first conducted a hazard analysis and risk-control exercise that identified the current preventive and mitigation measures and further actions needed to improve the critical situation faced.
Because no major, serious, or high-potential accidents involved heavy transportation, the team focused on light vehicles, most of which were rentals in good condition and in compliance with the corporate standard.
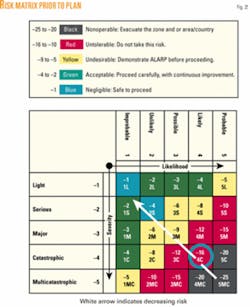
To assess initial risk, the team applied a corporate risk matrix (Fig. 2) with the following worst-case scenario:
“A major accident, such as a rollover, causing severe injuries to more than one passenger. No death is considered because of the mitigation measures in place.”
The initial risk-assessment results were:
- Likelihood-Likely; occurs a few times/month at most locations. In 2004, an average of two vehicular accidents/month occurred.
- Potential severity-Major; six CMS and three light crashes occurred during the last 2 years. Mitigation measures reduced the severity and prevented injuries.
- Initial risk-Intolerable; do not take this risk.
Driver considerations
The team analyzed driving profiles, fleet movement trends, and the needs and preferences of the drivers, employees, and expatriate families with a survey that provided key conclusions for the loss-prevention team to formulate improvement actions.
Categories in the accident profile for driver type included manager, engineer, staff, field employee, and professional driver.
The data showed that the professional drivers had accidents in lower numbers and potential severity than any other type of driver. It also found that they generally have better concentration and thus improved practical application expected behavior.
The survey included the distribution of miles driven by the hour of the day and vehicle occupancy, finding that most driving involved a single occupant traveling to and from work during peak hours. This increased exposure unnecessarily.
Improvement actions considered a driver’s type of work because some jobs such as operations and marketing required flexibility and mobility for day-to-day relations with clients and suppliers. Personal considerations also were factored in to support employee morale.
One finding was that the poor local public transportation system restricted employee mobility and jeopardized morale, both of singles and those with families.
Developing and implementing the plan included active interaction with all involved, including expatriate family members, to seek employee feedback further to reduce risk, gain driver buy-in to improve behavior; and ensure management commitment to provide needed resources.
Incident root causes
An in-depth analysis of the near-misses and actual accidents determined common root causes, with three main factors found:
- External factors of the local driving environment.
- Driver attitudes and skills.
- Large exposure because of miles driven.
This country had increasing accident rates and auto fatalities. For example, in 2004, the fatality rate/10,000 vehicles was 8.9, compared to 2.0 in the US and 1.5 in the UK. Since 2002, auto accident deaths have increased steadily, with local authorities reporting a 15% increase compared to the previous 3 years.
The situation will likely worsen with projects under development. Also, the country’s most common intersection is a roundabout where about 60% of the accidents involving company vehicles had occurred in the previous 2 years.
During the same period, third parties caused three of the six CMS company crashes.
Investigations (2003-05) indicated that, in this location, 70% of the accidents were attributed to driver lack of skill as a personal factor. The data showed that company drivers lacked a mature crash-free attitude and neglected to apply defensive driving principles in about half the accidents.
While drivers could recite readily the principles, the gap was with their willingness to apply them. Moreover, instructors did not effectively address this behavioral issue.
Before 2004, all driving instructors were field operators and foremen who dedicated only part of their time to defensive-driving training and practical “commentary drives.” With the increased activity, training lacked the personal commitment to address behavior as well as basic knowledge of driving skills.
The survey clearly showed that drivers as the only occupants drove 75% of the miles, with about 30% of the miles being driven to and from work during peak hours. This meant that drivers were unnecessarily exposing themselves.
In this location, the number of miles driven increased to 1.2 million in 2005 from 600,000 in 2003. Options were needed to reduce the miles driven.
Devised plan
The analysis led to a plan with the following five “must have” elements.
- Management commitment: Managers lead plan implementation and oversee enforcement.
- Risk reduction (likelihood): Initiate monthly tracking, reduce exposure (miles driven), and increase professional driver use.
- Addressing employee and driver behavior: Recognize good performance and apply accountability concept. Emphasize the importance of attitude in training sessions, commentary drives, and employee and driver meetings. To support morale, consider public transportation limitations.
- Operational needs accommodations: Revaluate actions to avoid negative impact on activities.
- Segment-specific needs accommodations: Allow individual business segments to develop tailored plans.
Reference 1 includes the specific actions taken and a detailed description of the management-approved action plan presented to the work force. Most of the action items focused on reducing exposure and improving driver behavior and skills.
The main indicator of driver performance used was the driving score taken from the driver improvement monitor. An equation calculates the score by combining three factors:
- Top speed factor (TSF) that includes maximum speed and cumulative time greater than the set speed limit.
- Harsh acceleration factor (HAF), or the acceleration greater than a set threshold divided by miles driven.
- Harsh deceleration factor (HDF), or the braking greater than the speed limit divided by the miles driven.
Driver score = TFS + HAF + HDF
The analysis normalizes the scoring into three categories of skill level:
- Green driver: Score between 0 and 2, good skills.
- Yellow driver: Score between 2 and 5, requires direction for continuing improvement.
- Red driver: Score greater than 5, requires immediate coaching and improvement.
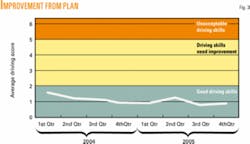
The lower the score, the better the driver’s performance, with the average score used to assess trends for different areas. This location achieved a sustained improvement from an average score of 1.75 in first-quarter 2004 to 0.9 in last-quarter 2005 (Fig. 3). Since October 2004, management has presented regular awards to the best drivers as well as enforcing accountability for drivers with poor performance.
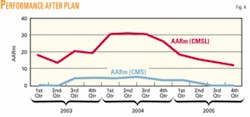
The AARm depicted in Fig. 4 is the main lagging performance indicator for both CMS and CMSL accidents during 2004 and 2005. No CMS accidents occurred during the last 15 months of the study.
The AARm (CMSL) trend, also improved, falling by 2006 to a lower level than in the previous 4 years.
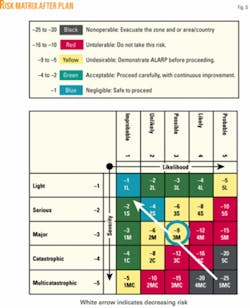
Using the same worst-case scenario as in the initial risk evaluation, described previously, the residual risk (Fig. 5) is as follows:
- Likelihood-Possible; will occur a few times/year in most areas. The plan has achieved good results, with no CMS accidents occurring in the past year and reduced light accident numbers and potential severity for most. Moreover, driver performance and reduced exposure improved by 20%.
- Potential severity-Major; maintained mainly because of the environmental factors.
- Residual risk-Undesirable; demonstrate risk to be ALARP, “as low as reasonably practicable,” before proceeding.
Future plans
This risk-based improvement plan effectively demonstrated that factors causing accidents can be determined and specific actions addressing their root causes can be defined. Management commitment, however, is needed to provide the resources and to gain work-force buy-in. Without this element, a plan is destined to fail.
The management team will continue to review the plan, define specific actions and outline initiatives to sustain the performance achievements, and further improve the risk control measures for the long term.
Reference
- Lopez, J.C., Tate, D., and Lane, K., “Risk-Based Driving Improvement Plan (Beyond Traditional Approaches), Paper No. SPE 98523, SPE International Conference on Health, Safety and Environment in Oil and Gas Exploration and Production, Abu Dhabi, Apr. 2-4, 2006.
The authors
Juan Carlos Lopez is a quality, health, safety, and environmental manager with Schlumberger, where he has held various overseas assignments in Latin America and the Middle East. Previously, he was a production engineer for different national and multinational companies. Lopez has a BS in civil engineering from Universidad Nacional de Colombia.
Based on a presentation to the SPE International Conference on Health, Safety, and Environment in Oil and Gas Exploration and Production, Abu Dhabi, Apr. 2-4, 2006.
