PROCESS CONTROL-Conclusion: Ethylene plant uses best practices to improve controller performance
Nova Chemicals Corp. used a holistic, best-practices approach to help sustain and improve the performance of control system assets at its Joffre, Alta., ethylene plant.
This article, the second of two, will discuss a case study that describes the maintenance of a multivariable predictive control (MPC) controller, quickly identifying problems in the MPC itself, and in the regulatory control and instrumentation layers.
The first part (OGJ, Oct. 9, 2006, p. 52) discussed MPC systems, causes of poor performance, and the best-practices approach.
NOVA Chemicals case study
NOVA Chemicals Corp. operates three ethylene plants and two polyethylene plants at Joffre, Alta. This case study describes a DMCplus controller that was commissioned at this plant.
The process separates two feed streams into three components-a light hydrocarbon and two considerably heavier hydrocarbons. The middle component is removed in a side draw, which is then further purified in a side column. The application covers the feed drum, where the two feed streams are mixed, the main column, and the side column.
Software solution
Nova installed a control asset-management solution that provides a methodology and performance monitoring that aim to improve performance while simultaneously lowering the long-term cost of sustaining the performance of control assets in the whole organization.
The solution, ProcessDoctor Online, monitors applications and reports on performance and diagnostic measures. More importantly, it integrates with plant maintenance business processes, providing all interested parties with information needed for specific job functions in the applications’ maintenance work processes.
It contains these best-practice functions:
- Benefit documentation.
- A holistic control asset-monitoring and reporting platform.
- Targeted information.
- Flexible deployment.
- Compatibility with multiple controller technologies.
It allows plants with MPC applications to document their benefits and automatically report the benefits to senior managers. It provides continuous monitoring of MPC and regulatory controls and instrumentation, can be deployed on site, at corporate headquarters, or deployed as a service, and is compatible with several different commercial MPC packages.
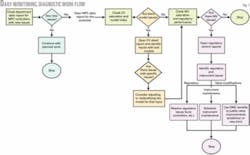
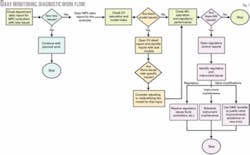
It also supports several monitoring and diagnostic work flows. Monthly reviews by managers, daily or weekly monitoring by engineers, and long-term assessments by engineers to find subtle patterns of behavior are all supported. This article will discuss the daily monitoring and diagnostic work flow shown in Fig. 1.
The work flow is intended to facilitate the standard investigations that engineers must perform in order to maintain MPC applications. It focuses on the most common maintenance problems with MPC controllers, and integrates the investigation of MPC, regulatory control and instrumentation.
Nova application
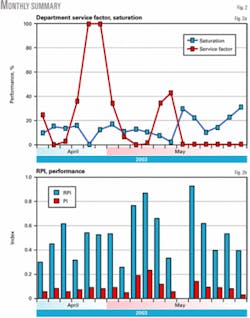
Fig. 2 shows an excerpt of the monthly report for this controller. It has only been in service occasionally and when active its performance has been weak. The service factor has only been 100% for 2 days, and on 5 other days it was only turned on for about a third of the day, probably during the day shift while engineers were present.
The controller relative performance index (RPI) is a composite index that compares the speed of the controller to its original design performance. When the RPI is 1, then the controller is performing as designed. If the RPI is less than 1, then the controller is slow.
RPI is described in detail in Shah et al.1 and Huang and Shah2 and applications of RPI to industrial controllers are described in Gao, et al.3
This controller is quite slow; RPI varies somewhat from day to day but averages 0.5 when the controller is in service. Clearly there are some issues with this controller.
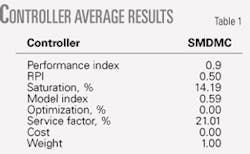
Table 1 shows another excerpt from the department summary. It shows the monthly average values for the specific controller. Saturation, at 14%, is an insignificant issue for the controller as a whole, although it may be an issue for individual controlled variables (CVs) or manipulated variables (MVs).
The model index shows some problems. Model index is a measure of the accuracy of the models in the DMC controller. Values close to 1 indicate good models and values below 0.5 indicate significant problems with the models. The average model index of 0.59 for this controller indicates that there are some models with significant problems.
Daily analysis
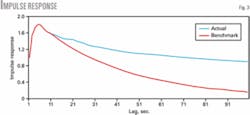
Fig. 3 shows the impulse response graph for the last day the DMC controller was active. It shows that the controller is slow relative to the desired, or benchmark, performance. Disturbances, models, poor regulatory control, or constraint issues may cause this.
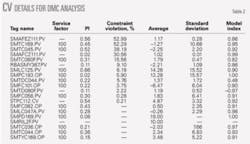
Low values for CV constraint violation (14.47%) and MV saturation (12.53%) indicate that the controller is not significantly affected by the active constraint set, but the model index of 0.62 indicates some problems with the models. The next step is to review the CV details in the same report (Table 2) to investigate the low model index.
Details for the CVs show that most of the models are excellent, except for three CVs: SMTDC044, SMTD080F, and SMRIL2F. Of these, two have been disabled (service factor is equal to 0). The third, SMTDC044, must be investigated.
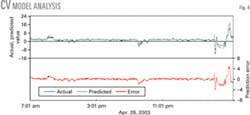
The detail report for SMTDC044.PV shows that the prediction error does rise and fall with the value of the CV itself. This is particularly clear at the very end of the data set. Analysis of the contributions to prediction error shows that a feed-forward variable, SMTI042.PV, is most likely causing the prediction error. The model between SMTI042.PV and SMTDC044.PV is the most likely cause for the poor predictions (Fig. 4).
Further analysis of the average model index during the month indicates that models are excellent, with a few exceptions. SMTD080F and SMTDC044 have consistently poor predictions, and SMTC080F is marginal, with an average model index of 0.66.
For all of these CVs, the manipulated variable SMFCRFLX.SP is usually among the MVs that correlate well with prediction error. While there are other MVs that correlate with the prediction error, SMFCRFLX, the column reflux, is likely to be a dominant variable. The models corresponding to this MV are therefore suspicious and should be investigated to see if they need to be reestimated.
MV analysis
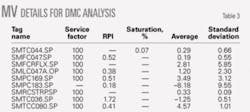
Although there are a few bad models, the main problem with this controller is not prediction. Most of the models are excellent. Analysis of the MVs does illustrate a problem (Table 3).
The MV analysis shows that the regulatory control is at fault. Of the controllers analyzed that were in service that particular day, only one, SMTC036, has an acceptable RPI value at 0.72. All of the other regulatory controllers show poor performance. Again, RPI should be close to 1. Values less than 0.5 may indicate problems with regulatory control.
Analysis of SMFC047, the column feed flow controller, shows problems with a sticking valve, as can be seen in a regulatory control report excerpt. The RPI is 0.5, and the valve stiction of 0.31 indicates that the controller output must change by 0.31% before the valve begins to move.
The actual settling time of the controller is 7 min, even though the desired settling time is 1.5 min. In other words, it takes this controller 7 min to remove the effects of disturbances. This is extremely slow.
The valve is sticking 0.3%, which is not a large amount, but is responsible for almost 30% of the control error. For this particular controller, there may be a tuning issue, but the dominant issue is the sticking valve.
The recommendation is that a positioner be added to the valve. The positioner will improve the performance of this flow controller and, therefore, the DMCplus application. The cost of the positioner can be justified by the benefits of the DMCplus controller.
Case study conclusions
This controller still has significant issues with the models corresponding to the column reflux and SMTDC044.PV, and some regulatory control and instrumentation issues. There are currently no significant constraint issues.
The best-practice integration of MPC, regulatory control, and instrumentation analysis in a single system supports the actual monitoring, diagnostic, and troubleshooting process followed by engineers responsible for commissioning and maintaining the application.
Acknowledgment
We acknowledge the support and cooperation of Nova Chemicals Corp. for participating in the case study and permitting the publication of their data.
References
- Shah, S., Patwardhan, R., and Huang, B., “Multivariate Controller Performance Analysis: Methods, Applications and Challenges,” CPC 6 Conference, Tucson, Ariz., Jan. 7-12, 2001.
- Huang, B., and Shah, S.L., Performance Assessment of Control Loops: Theory and Applications, New York: Springer-Verlag, 1999.
- Gao, J., et al., “Performance Evaluation of Two Industrial MPC Controllers,” Control Engineering Practice, November 2003, pp. 1371-87.
