Drilling confirms radar-mapped atmospheric seepage anomalies
This article will discuss three types of atmospheric seepage anomaly (ASA).
Pickett’s Ridge is an Eocene Yegua (8,500 ft) ASA that demonstrates that atmospheric seepage anomalies disappear with production, reflecting the response to a changing subsurface accumulation.
Sand Ridge is an Eocene Wilcox formation ASA at a depth of 12,000 ft. It is an example of a deeper trap that was recognized and differentiated from an overlying, existing Yegua field using the ASA.
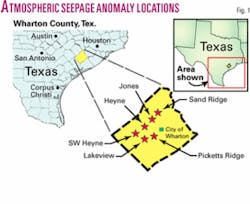
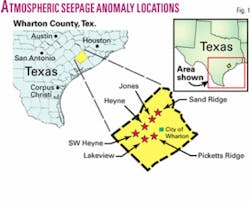
Jones, the third ASA, at about 7,600 ft, was mapped as one seepage anomaly but reflects two adjacent gas sands. The locations of these three ASAs are shown on Fig. 1 along with the three ASAs presented in a previous article (OGJ, July 31, 2000, p. 75).
Introduction
The authors formed Premier E&P in 1992 to resolve the question: Can oil and gas fields be quickly, cheaply, and accurately identified in the subsurface by mapping seepage in the atmosphere?
The first author and Merrill Skolnik in 1996 published a two-part article1 2 on radar mapping of atmospheric seepage to locate hydrocarbon accumulations in the subsurface.
In 1997 Skolnik and Bailey coauthored a paper presented at the Southern Methodist University Fifth Unconventional Methods Conference3 on the same topic. In 2000, a third article4 discussed the successful drilling of three ASAs in Wharton County, Tex.
In 1992 Premier E&P funded a seepage survey over the northern half of Wharton County. Premier found seepage clouds (ASAs) present in the atmosphere directly above most Yegua and Wilcox fields in Wharton County. The company also found numerous anomalies with no wells drilled to the Yegua or Wilcox.
Premier resurveyed the same area in 1998 and again in 2004. Premier found no new anomalies in the two resurveys, indicating that the features are fixed.
These ASAs had several characteristics:
- They were a definitive size and shape.
- They appeared as the same size and shape after each survey except after they had been produced, and they then shrank in size or disappeared.
- Those over recently developed fields conformed to field boundaries.
- They were oriented parallel to the structural trends of the area.
The publishing of articles in the last 10 years validating vertical movement of gas molecules to the surface has confirmed Premier’s conclusions about the validity of atmospheric seepage mapping to locate subsurface hydrocarbon accumulations.
Depth to the trapped hydrocarbons is determined in a number of ways but primarily by the shape and size of the seepage anomaly with respect to subsurface traps when mapped on 3D seismic surveys.
Production effects
Premier’s 1992 survey identified Picketts Ridge, a 200-acre ASA named after the Yegua field that was present on the far southwest end of the ASA (Fig. 2).
This ASA was an elongate anomaly with the Energy Development No. 1 Barr, producing 1.2 MMcfd of gas and 23 b/d of oil (completed in 1991) located in the southwest corner of the anomaly. It appeared to Premier that an offset opportunity could be drilled in the northeast part of the anomaly.
In attempting to lease the offset acreage, Premier found that a company was already preparing to drill to the northeast about a half mile. The Landers No. 1 was located on 2D seismic data to test the crest of a Yegua structure (Fig. 2). This structural test was located just outside the ASA.
The well cut three Yegua sands but was plugged and abandoned as the sands were tight and wet. In 1996, after 5 years, the No. 1 Barr well went off production.
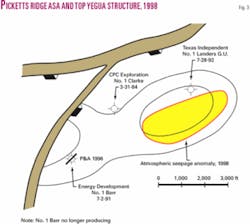
Premier resurveyed the Picketts Ridge Prospect in 1998 to determine what effect the depleted No. 1 Barr had had on the ASA. That survey found that the ASA was now absent around the Barr well but was still present to the northeast covering 160 acres (Fig. 3).
Premier interpreted this to mean that hydrocarbons were still trapped and that the No. 1 Barr did not drain the entire accumulation. This makes sense considering the Barr well produced only 0.315 bcf but the original ASA covered 200 acres.
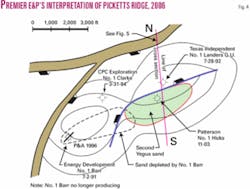
In 2003, Patterson Petroleum drilled this remnant ASA 500 ft south of the Landers dry hole and made a completion in the Lower EY Yegua sand at a rate of 1.5 MMcfd and 325 b/d of oil. Patterson’s well confirmed Premier’s interpretation of hydrocarbons still trapped as reflected by the remnant ASA. This discovery well, despite its proximity to the No. 1 Landers, had a much thicker and more productive sand package (Fig. 4).
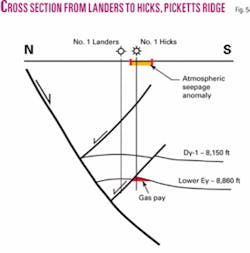
It was now apparent that the ASA at Picketts Ridge was actually composed of three sands and two trap styles (Fig. 5). After the No. 1 Barr depleted the two shallower Yegua sands, the bottom sand became apparent in the 1998 seepage survey.
Several things can be gleaned from the drilling of the Picketts Ridge prospect. The presence of the ASA on the flank of what had been mapped as a Yegua structure was an indication that this was not purely a structural-high trap. Another component that was overlooked was the antithetic faults that were controlling the hydrocarbon trap.
Multiple vertical traps
In the 1992 survey, Premier identified a 1,200-acre ASA that enclosed the Egypt/Bonus SE Yegua field (Fig. 6).
The obvious conclusion would have been that the ASA was associated with the Yegua production, but a clue something was amiss is that the productive area of the 9-year-old Yegua field was much smaller than the ASA.
Egypt/Bonus SE Yegua field had been discovered in 1983 and had an original pressure around 3,100 psi. At the time of the survey in 1992, the field pressure was down to about 600 psi, and the field had produced in excess of 12 bcf and 30,000 bbl of oil.
In the authors’ experience, as fields produce and the pressures decline, the seepage that reaches the atmosphere is greatly reduced and may disappear. This decline in atmospheric seepage usually occurs in the first 3 years of production. By the time of the 1992 seepage survey, this field was 9 years old and the pressures had dropped by 75% but the atmospheric seepage signature was strong and covered a larger area than the Yegua wells (Fig. 6).
Based on Premier’s experience with the Picketts Ridge anomaly, the Sand Ridge ASA should have been weak, almost absent, or broken into individual undrained areas if the Yegua accumulation was responsible for the ASA (Fig. 6).
Premier suspected a deeper productive zone was generating the strong ASA. This interpretation was confirmed in 1999 when the National Onshore No. 1 Schweinle was completed as a Wilcox discovery in the ASA at the location shown on Fig. 7. The well flowed at a rate of 10 MMcfd and 325 b/d of oil with a bottomhole pressure around 7,500 psi.
This well is now one of more than 25 wells that makes up Bonus Southwest Wilcox field, which fills the ASA unlike the Yegua production. Fig. 8 is a sketch from a seismic line trending NW-SE across the Sand Ridge ASA. This cross-section shows the anticlinal trap at the Yegua level and the fault closure trap at the Wilcox level. This stacking of reservoirs in the Yegua and Wilcox is characteristic of Wharton County fields.
Sand traps juxtaposed
The Jones ASA mapped in 1992 covered 600 acres and was an isolated anomaly that was not on trend with other Wilcox or Yegua production (Fig. 9). It was an oval anomaly that was enigmatic without seismic to map the subsurface.
In 2004 Dynamic Energy drilled two wells in the Jones ASA. The wells were completed at two different depths in Yegua sands and had rates of 784 Mcfd and 6 b/d of condensate and 1.8 MMcfd and 46 b/d of condensate. The ASA appeared to indicate one trap but was reported to be two separate AVOs in the Yegua, which seems to be corroborated by the depths of the different perforated intervals (Fig. 9).
The ASA shape from well locations probably reflects two hydrocarbon traps that parallel the regional grain and are stratigraphic in nature. Contrast this with the Picketts Ridge ASA, where the traps are in line (Fig. 2).
The ASA survey identifies anomalies and places the explorationist in the immediate area of subsurface accumulation(s) but requires the interpretation of seismic data to define the trap(s) and their depth(s).
Track record
The airborne seepage surveys conducted by Premier in 1992 identified 21 significant ASAs in Wharton County.
Since the 1992 survey, seven of these have been drilled and are discoveries in the Yegua or Wilcox sand section. We believe this confirms that ASAs reflect vertical seepage of gas from subsurface hydrocarbon traps to the surface and then to the atmosphere. This atmospheric seepage information defines the size, shape, and geological orientation of hydrocarbon accumulations and saves time and improves success rates.
Premier’s airborne seepage work in Wharton County confirmed our postulation that an exploration program that begins with an atmospheric seepage survey can cut costs and immediately begin delineating drillable prospects when followed up with a solid geological and geophysical evaluation.
An airborne survey can assess 30,000 to 45,000 acres/day. As the Gulf Coast trend is now covered with extensive 3D surveys for sale, ASA mapping can be used to focus an explorationist on the specific areas to purchase 3D seismic data for prospect mapping.
Plans
Premier continues to purchase seismic data to develop anomalies defined from the 1992 survey.
One current prospect will test a deeper structure under a Yegua, Nod mex field. The strong anomaly over a depleted Nod mex field indicates the high probability of a deeper trap.
The other ASA to be drilled later this year is a 2,200-acre Wilcox trap. It was one of several ASAs larger than 2,000 acres Premier initially identified with the 1992 seepage survey. Other Wilcox ASAs in the immediate area have proven productive, and the similarity of this anomaly to them and Wilcox structure supports this as a Wilcox trap. A 3D survey was purchased and an up-to-the-coast fault develops a trap in the top 200 ft of the Wilcox, forming a three-way closure.
Acknowledgments
This exploration tool would have been dismissed for lack of science if not for two individuals, Dr. Merrill I. Skolnik, superintendent emeritus of the Radar Division of the Naval Research Laboratory, and Dr. Owen M. Phillips, Decker Professor Emeritus and Research Professor at John Hopkins University. Premier thanks Skolnik for having shared his knowledge and vast experience with radar and for coauthoring two papers with Bailey. Premier is indebted to Owen, a pioneer in geophysical fluid mechanics, which includes atmosphere turbulence, for his explanation of the radar returns. He provided the atmospheric model that explained the radar returns seen over hydrocarbon accumulations.
References
- Bailey, Thomas C., and Skolnik, Merrill I., “Science Behind Sensing Hydrocarbon Seepage Using X-Band Radar,” OGJ, Vol. 94, No. 49, 1996, pp. 85-88.
- Bailey, Thomas C., “Application of X-Band Radar to Sense Hydrocarbon Seepage,” OGJ, Vol. 94, No. 50, 1996, pp.72-75.
- Skolnik, Merrill I., and Bailey, Thomas C., “A Review of Radar for the Detection of Gas Seepage Associated with Underground Oil and Gas Deposits: Applications of Emerging Technologies,” Unconventional Methods in Exploration for Petroleum and Natural Gas V Proceedings, 5th Southern Methodist University Unconventional Methods in Exploration Series (Dallas), Oct. 30-31, 1997, pp. 207-228.
- Bailey, Thomas C., “Radar-mapped Seepage Anomalies Borne Out by Drilling in Wharton County, Tex.,” OGJ, Vol. 98, No. 31, 2000, pp. 75-77.
The authors
Thomas C. Bailey ([email protected]) has been a partner since 1992 in Premier E&P working on atmospheric seepage as a means to locate subsurface hydrocarbon traps. He has 38 years in oil and gas exploration. In 1968-91 he was with Amoco Production Co. (now BP America), where he served in various technical and management positions in domestic and international. He has worked in a wide range of stratigraphic settings and structural styles worldwide from Tertiary to Precambrian. Before retiring he chaired Amoco’s Surface Prospecting Task Force, which investigated microseepage exploration tools and methods.
James M. Grubb ([email protected]) started with Chevron and has worked for large independents such as Aminoil, Louisiana Land & Exploration, L.B. Simmons, and J.M. Huber Corp. With 34 years’ experience in the Texas Gulf Coast, he has spent the last ten years mapping and understanding how seepage anomalies relate to subsurface geology and hydrocarbon traps in Wharton, Jackson, and Fort Bend counties. His geological expertise is Wilcox and Yegua stratigraphy and structure. (www.premierE-P.com)
