US gas market responds to hurricane disruptions
Since 2002, storm-related natural gas production shutins in the Gulf of Mexico have had a much greater impact on the US gas market than in previous years. Facilities insurers seem to think this a trend that is here to stay.
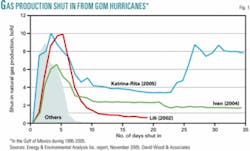
The combined effects of the 2004 and 2005 hurricane seasons had an impact across all sectors of the US gas industry. Hurricane Ivan, which made landfall in September 2004, caused more long-term gas production interruptions than any previous hurricane, but its impacts were dwarfed by Hurricanes Katrina (landfall Aug. 29, 2005) and Rita (Sept. 24, 2005). The combined effects of Hurricanes Katrina and Rita were by far the most damaging in the history of the US petroleum industry (Fig. 1).
The hurricanes also substantially damaged gas processing and pipeline facilities needed to process and deliver gas to customers. It will take the industry several years to recover from the disruptions, and some lost production will never be recovered.
The Gulf of Mexico accounts for 40% of US gas production. This concentration of gas production, processing, and transportation facilities in the gulf and on the Gulf Coast means that a significant percentage of domestic oil and gas production and processing is vulnerable to disruption by hurricanes.
The volume of gas production curtailed during the third week of October 2005 from both onshore and offshore areas of the Gulf Coast was 5 bcfd-about one half of prehurricane offshore production. The US Minerals Management Service (MMS) in June of this year reported that the cumulative shut-in gas production from Aug. 26, 2005, to June 19, 2006, was 803.6 bcf. That is about 22% of the total annual gas production in the gulf (3.65 tcf). To place this in perspective, 630 bcf of gas was imported into the US as LNG in 2005.
Status of recovery
Recovery efforts in the Gulf of Mexico in fourth quarter 2005 were impressive, returning to service some three quarters of the supplies shut in by offshore and onshore storm damage in Louisiana. The Federal Energy Regulatory Commission (FERC) reported in February of this year that 2.4 bcfd of production remained shut in by January-1.8 bcfd offshore and 0.6 bcfd onshore in Louisiana.
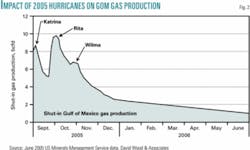
The pace of recovery alleviated immediate gas supply concerns for the winter of 2005-06. In the first half of 2006 there was a progressive and substantial improvement in both oil and gas production from the gulf. In Fig. 2 the volume of shut-in offshore and onshore Gulf of Mexico gas production illustrates the scale of the 2005 hurricanes’ impact and the pace of recovery.
Energy and Environmental Analysis Inc., Arlington, Va., forecast that cumulative gas shutins to August 2006 for Katrina and Rita would be 900-1,100 bcf. This volume, which has proved to be an accurate prediction, was more than five times the shut-in volume from Hurricane Ivan.
MMS in June reported shut-in gas production of 935.67 MMcfd. This is equivalent to 9.4% of the daily gas production in the gulf, which currently is 10 bcfd.
Of the 68 platforms still evacuated in June this year, 66 are in the Lake Charles, Lafayette, and New Orleans areas, where more than 80% of the shut-in gas is located. It now appears that at least some of this remaining shut-in production may never be fully recovered. These evacuations are equivalent to 8.3% of 819 manned platforms.
The position for gas was substantially better than for oil. MMS in June reported shut-in oil production of 179,970 b/d of oil, equivalent to some 12% of the daily oil production in the gulf, i.e., about 1.5 million b/d.
Spot gas prices impact
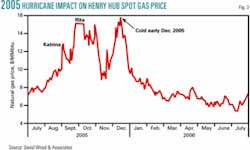
After Hurricane Ivan, Henry Hub gas prices increased to a peak of $8/MMbtu from $6/MMbtu in July 2004. By February 2005, gas prices had returned to slightly more than $6/MMbtu but shot up again during the summer to about $10/MMbtu as world oil prices rose and gas supply concerns increased. Gas prices then increased significantly in third quarter 2005, trading as high as $16/MMbtu on spot markets after Hurricanes Rita and Katrina (Fig. 3). The spot gas price trend at Henry Hub from July 2005 to July 2006 illustrates the impact of the 2005 hurricanes and, apart from early December 2005, the mild winter that followed.
Since then, prices have fluctuated predictably with changing weather: lower during a warm November 2005, higher during very cold weather in early December 2005-peaking above $15/MMbtu-and again moving lower during the milder 2006 winter and spring. Prices dropped progressively to less than $5.50/MMbtu in early July of this year from above $8/MMbtu in late January, but prices reversed in July, rising above $8/MMbtu on July 31 to the highest level in almost 6 months. The price hike was a response to hot summer weather and anticipated record seasonal demand for electricity.
These prices, although much lower than the peak prices in third and fourth quarters 2005, are still high by historical US standards. Before the hurricanes, gas prices had reached levels that reflected an ongoing tightness between supply and demand. Despite the mild 2005-06 winter, gas markets appear to expect gas prices to remain high in historical terms for some years. These prices likely will persist until domestic gas production increases or, more likely, until additional LNG import capacity materializes.
Declining domestic production, coupled with increasing demand and limited import capacity, caused the tight gas supply-demand balance that has prevailed in recent years. This undoubtedly magnified the impact of large-scale hurricane disruptions on energy supply and prices and is also influencing ongoing responses.
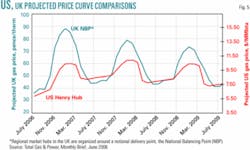
Spot Henry Hub gas prices averaged $8.86/Mcf in 2005, and the US Energy. Information Administration (EIA) in July of this year expected prices to average less than $7/Mcf for the third quarter. Barring extreme weather for the remainder of 2006, EIA in July expected a decline in the 2006 annual average Henry Hub spot price to about $7.61/Mcf. However, the agency expected these relatively low prices to be short-lived, as concerns about potential future supply tightness and continuing pressure from high oil market prices could drive spot gas prices to just over $9/Mcf in winter 2006-07 (Fig. 5). EIA forecasts that Henry Hub prices will average $8.13/Mcf in 2007.
Storage inventory trends
The US gas industry entered winter 2005-06 with high levels of gas storage despite the supply interruptions from the hurricanes. This was a strategic and prudent response to provide insurance against the possibility of a cold winter, which fortunately did not materialize. EIA documents the volume of working gas in storage in the Lower 48 states as 2,756 bcf as of July 21. Gas stocks were 379 bcf higher than for the same week in 2005 and 490 bcf above the 5-year average of 2,266 bcf. Stocks in the producing region were 154 bcf above its 5-year average of 696 bcf.
Total working gas in storage, which has remained above the 5-year historical range since February of this year, is serving as a security cushion against potential disruptions from the 2006 hurricane season (Fig. 4). The relatively warm winter of early 2006, mild spring and early summer temperatures, and the wide difference by which prices for future delivery contracts for the 2006-07 winter months exceeded spot prices have contributed to this high midyear gas storage level.
Indeed, LNG imports in the first quarter of this year were down substantially from 2005 and 2004 levels, partly due to high gas stocks, but LNG imports rebounded strongly in the second quarter to further boost gas stocks.
Regulatory responses
In addition to increased gas in storage, the impact of the hurricanes triggered action by regulatory authorities, who accelerated progress in gas infrastructure and market developments that had been impeded by slow regulatory responses in recent years. These include:
- Approving applications for a substantial number of new LNG receiving terminals to facilitate expansion of imported gas.
- Approving applications for new pipelines and changes to pipeline tariffs to help pipelines force compliance with operational flow orders. This will enable pipeline companies to maintain system reliability and avoid bottlenecks during periods of unexpected gas supply interruption.
- FERC this year strengthened its enforcement policy and its ability to detect gas market manipulation, which has been an historic problem for the gas markets during periods of high prices. It also now has powers to impose higher penalties for market manipulation violations.
Since deregulation of the US gas market in 1989, FERC does not directly regulate most wholesale gas prices and has no jurisdiction over retail gas prices, but it does issue infrastructure approvals and has the power to act against illegal manipulation of the gas markets.
Future price implications
Gas prices on the futures exchanges-the forward price curve-provide an indication of market expectation for prices in the near term. Forward price curves indicate supply-demand constraints in both US and UK gas markets to 2009 (Fig. 5). These are not price predictions but what the market is willing to trade at now for future supply. In practice, gas spot prices are strongly influenced by weather, with hot summers and cold winters tending to increase spot gas prices, while mild weather lowers them.
High gas inventories have a moderating effect on price rises; low inventories have the opposite effect. The forward curve is similarly impacted by gas inventories (and vice versa) and by supply-demand fundamentals and perception. Lack of import capacity and potential disruption to domestic and international supplies do lead to increased forward price curves, and this is what the US gas markets continue to experience.
Forward prices for winter 2005-06 were some 25% higher than the July 2006 prices (front month of the forward curve) quoted in June 2006 (Fig. 5). Through to 2009 the forward price curve of early July 2006 anticipated recurring peak winter prices of $10-11/MMbtu for the next three winters, with gas prices remaining above $7.50/MMbtu each year through to July 2009.
Such prices remain highly attractive for the development of international LNG projects-with break-even prices at $2.50-3.50/MMbtu-to supply the US gas market in the medium term through new LNG receiving infrastructure.
Gas prices in the longer-term will depend on several factors, such as world oil prices and the pace of development of additional gas supply through LNG imports.
The effect of near-term domestic gas supply constraints and potentially high prices are apt to be felt primarily in the eastern US, which is most dependent on gas from the Gulf Coast region. The western US, which receives gas from the Rockies, West Texas on-shore producers, and Canada, should be affected less.
The limited current capacity to move gas from west to east may create a marked differentiation between gas prices in the eastern and western US. Such impacts are potentially most significant for large industrial and power generation gas consumers, who have tended in recent years to rely more on spot market gas purchases.
Future gas imports role
In 2005, the US produced 84% of the gas it consumed, but few believe that this is sustainable because of dwindling domestic gas reserves. The US imports the remainder from Canada and from overseas as LNG. Canada is part of the same market trading area and is also experiencing tight supply-demand balances in the near term. The US competes with the two other major gas-consuming regions, Europe and Asia, for its LNG imports. Most gas is traded into those regions under long-term sale and purchase contracts.
EIA, in its “Short-term Energy Outlook, July 2006,” projects that total US gas consumption this year will fall below 2005 levels by 1.7% then increase by 4.2% in 2007. An exceptionally warm January 2006 has residential gas consumption projected to fall in 2006 by 7.4% from 2005 levels and then increase by 8.8% in 2007. Following recovery from the 2005 hurricane season, the output of gas-intensive industries likely will contribute to a 1.4% growth in industrial gas consumption this year and 4.7% in 2007.
In 2005, US dry gas production declined by 2.7%, largely because hurricanes damaged infrastructure in the Gulf of Mexico. EIA projects dry gas production to increase by 0.6% in 2006 and 1.1% in 2007, which will not keep pace with demand growth. EIA also forecasts total LNG net imports to increase from their 2005 level of 630 bcf to 760 bcf in 2006 and to 1,000 bcf in 2007.
Even where markets have been deregulated and spot markets are active, e.g., the UK, prices have from time to time been higher than those experienced in North America in the last 2 years (Fig. 6). The 2005-06 winter in Europe was very cold. In addition, tight supply caused by interruptions of pipeline gas from Russia in January during a dispute with transit country Ukraine resulted in high gas prices in continental Europe and some supply disruption.
An even tighter near-term supply shortfall in the UK has resulted in high spot and forward gas price curves as demand outstrips import infrastructure capacity, and disruptions of gas storage capacity have exacerbated the problem in 2006. The highly seasonal UK gas forward curve anticipates a continued problem in winters through to 2008-09 (Fig. 5).
Depending on contract price indexation either to the price of oil-common in Europe and Asia-or a gas hub benchmark price such as Henry Hub in the US or the UK’s National Balancing Point, the price of delivered LNG can vary substantially between regional markets. As a result, where short-term contracts permit, gas sellers have diverted LNG deliveries to northwest Europe to take advantage of the high prices, and deliveries of LNG to the US were lower as a consequence in fourth quarter 2005 and first quarter 2006 (Fig. 6). Of course, diversions in the other direction also occur when the prices in the US exceed those in Europe.
In the future, as more gas-producing countries build LNG liquefaction-export plants, diversifying and increasing overall supply, international competition for that gas is expected to be strong, particularly in the Atlantic Basin. As a result, new LNG import terminal and regasification infrastructure is set to play a key role in the future US gas supply, and both long-term and short-term LNG contracts will probably be required to secure LNG volumes in periods of peak demand.
Bibliography
Argus Global LNG Monthly, regional LNG price data (www.argusmediagroup.com).
Energy and Environmental Analysis Inc., “Hurricane Damage to Natural Gas Infrastructure and Its Effect on the US Natural Gas Market,” submitted to The Energy Foundation, November 2005.
Energy Information Administration (EIA), “Short-Term Energy Outlook,” July 11, 2006.
EIA “Weekly Natural Gas Storage Report,” July 21, 2006.
Federal Energy Regulatory Commission, “High Natural Gas Prices: The Basics,” February 2006.
LNG Observer, July-September 2006, PennWell Corp. LNG monthly import statistics supplement to OGJ.
US Minerals Management Service press release, June 21, 2006, “Hurricane Katrina-Hurricane Rita Evacuation and Production Shut-in Statistics Report,” June 19, 2006.
Total Gas & Power, Monthly Brief, Gas forward curve comparisons, June 2006. LNG Explorer, July 2006.
The authors
David Wood ([email protected]) is principal of David Wood & Associates, an international consultant specializing in the integration of technical, economic, risk, and strategic information. He holds a PhD from Imperial College, London. His services include project evaluation, research, and training on a wide range of technical and commercial topics. Based in Lincoln, UK, Wood operates worldwide.
Saeid Mokhatab ([email protected]) is a natural gas engineering research advisor for the University of Wyoming’s Chemical and Petroleum Engineering Department and is an international associate of David Wood & Associates. He has participated as a senior consultant in international projects and has written extensively on gas transportation, LNG, processing, gas economics, and geopolitical issues. Mokhatab holds a BS in gas engineering from the University of Tehran and an MS (2000) in chemical engineering from Tarbiat Modarres University, Tehran. He is a member of the Society of Petroleum Engineers and several other professional organizations.


