Study evaluates design of high-capacity CO2 injection plants
This article discusses major aspects related to the design and future operation of a high-capacity (~9,200 tonnes/day) CO2 injection facility. In particular, the need for a dedicated dehydration facility is carefully evaluated using CO2-water saturation curves.
Conventional process simulators are unable to accurately predict these curves and are increasingly inaccurate at supercritical conditions. A more rigorous approach is therefore chosen in this study: a sophisticated software program uses a two-fluid model (i.e., Henry’s law approach for the aqueous phase and an equation-of-state for the nonaqueous phase) to generate the water saturation curves. Our technical data group validated the program using a composite of experimental and simulated data.
Emergency venting options during plant shutdown or potential upset conditions are illustrated. Where applicable, the “lessons learned” from KBR’s past experience in designing and commissioning high-capacity CO2 injection units is incorporated.
The article also presents cost comparisons for some of the selected design cases and for the injection pipeline. Additionally, an overview of material selection and safety and operability issues related to the CO2-compression equipment and pipelines is provided.
It is expected that the proposed design will provide a reliable and cost-effective means of high-capacity CO2 injection.
CO2 injection, gas processing
CO2 injection (acid-gas injection) and geological sequestration is a viable option to reduce or eliminate CO2 and H2S emissions from gas processing plants. Because this is an emerging technology, limited experience is available in the compression and transmission of dense-phase CO2, with most experience restricted to low injection rates. Greater demand for curbing greenhouse gas and sulfur emissions makes safe and reliable large scale CO2-injection facilities a key priority for many gas-processing plants.
CO2 from reservoir feed gas needs to be limited in gas processing plants to trace levels to avoid freezing at cryogenic temperatures. The feed stream to the gas processing plant is generally treated in dedicated facilities to remove acid gases in a solvent-based process. Regeneration of the solvent releases a water saturated stream rich in CO2.
The injection process consists of three major steps:
- Compressing the CO2 to reduce the injected volume.
- Transmission of the compressed fluid via pipelines.
- Injecting the CO2 into deep saline aquifers or oil and gas reservoirs.
Demand for CO2 injection
A strong and continuing demand for natural gas and tighter emissions control regulations have resulted in a requirement for high-capacity CO2 injection facilities. For instance, analysts predict that $31 billion will be spent on constructing 27 new LNG trains during 2005-09.1 The key implication is that CO2 compressors of unprecedented size must be designed to provide cost-effective injection solutions.
CO2 injection facility design
This article focuses on the design and future operation of a high-capacity CO2 injection facility to sequester CO2 released from a gas processing plant. We conducted a detailed study exploring the injection design options.
The project concept is based on 9,200 tonnes/day (t/d), equivalent to 175 MMscfd, of CO2-rich acid gas (99.5 mole % CO2 and 200 ppm (vol) H2S) released from the plant’s acid-gas removal unit (AGRU). This acid gas is compressed in four stages from an inlet pressure of 1.8 bara to a final discharge pressure of 215 bara.
After each compression stage, the acid gas is air cooled to about 43° C., where any condensed water is removed. After the final compression stage, dense fluid is transported via pipelines into various disposal wells and injected into a saline aquifer. At the discharge condition, the CO2 stream is supercritical, which increases the hydrostatic head of the fluid in the well and reduces the required injection pressure.
Study objectives
The magnitude of the current injection rates (9,200 t/d) posed design challenges that required careful investigation. A strategic approach was therefore selected that included a thorough review of published literature, performing water content simulations and dispersion calculations, sharing KBR’s experience pertinent to this area, and by equipment and pipeline cost comparisons.
Some of the specific objectives of the study were to:
- Determine whether or not a dedicated dehydration unit is required.
- Identify venting options for safe disposal of acid gas during upset scenarios.
- Compare compression options: compressors only vs. compressors and pumps.
- Provide a cost comparison for the selected design cases, and for carbon steel vs. stainless steel injection pipeline options.
Acid-gas dehydration
When an acid-gas stream is saturated with water, its propensity for corrosion and hydrate formation is greatly enhanced. Due to problems associated with acid-gas equipment failure, most injection facilities use a dedicated dehydration unit to ensure that the acid gas is undersaturated throughout the system.
When the acid gas stream is undersaturated, hydrates cannot form until the temperature drops substantially. Similarly, when the acid gas is not in contact with a free-water phase, corrosion will not be an issue and carbon steel can be conveniently used for equipment and pipelines. Both literature and operating experience strongly support this fact (OGJ, Apr. 28, 1997, p. 67).2
To examine whether or not a dehydration unit is required, it is essential to determine the thermodynamic and physical properties of acid gas, such as water content, hydrate formation temperatures, dew point, and bubble point. In particular, the saturated water content plot as a function of temperature and pressure is widely used as a standard.
CO2-water saturation curves
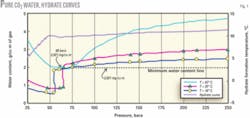
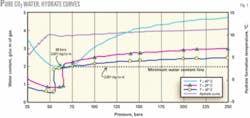
Fig. 1 shows the saturated water content of pure CO2 as a function of pressure for various temperatures. H2S at a 200 ppm (vol) concentration has practically no effect on the water saturation values and therefore the reported data is based on a 100% CO2 stream.
Data in Fig. 1 are computed using AQUAlibrium (version 3.0), a commercially available software package. The software uses a well constructed, thermodynamically consistent, two-fluid model that considers Henry’s law approach for the aqueous phase and an equation-of-state for the non-aqueous phase. This method is effective for acid gases; most commercial simulators are unable to accurately predict this curve and fail especially at greater pressures.3 4
Moreover, the data in Fig. 1 was verified by the KBR technical data group using data generated by the GPA research program,5 6 and also independently validated by Sogapro Engineering Ltd., Calgary. The expected uncertainty in the data is less than 5%.
For this plot, we chose these temperatures in accordance with the information provided in the project’s design basis:
- 43° C. (high ambient temperature of 33° C. + 10° C. air cooler approach).
- 25° C. (average ambient temperature).
- 18° C. (low ambient temperature).
In Fig. 1, for all the temperatures, the water saturation values (in g/cu m) decrease with pressure, attain a minimum and increase subsequently at higher pressures. This unique attribute is due to the fact that beyond certain pressures, a phase change occurs. Correspondingly, the water-holding capacity is greater due to a higher water absorption capacity in the liquid or dense-phase CO2 compared to vapor-phase CO2.
For the current injection conditions, a dedicated dehydration unit was not recommended as required for the following reasons:
In Fig. 1, the minimum water holding capacity corresponding to a temperature of 43° C. occurs at approximately 60 bara and has a value of 2,021 mg/cu m. If the acid-gas stream is condensed (via interstage cooling) at this temperature and pressure, the water content will remain at this level even for higher pressures (dashed line in Fig. 1).
For this situation, if the pipeline leading up to the wellhead at 215 bara were to be cooled to the low ambient temperature of 18° C., the acid-gas stream would still remain undersaturated. This is because the stream dew point corresponding to a water saturation value of 2,021 mg/cu m at 215 bara is 11° C.
Because the water-holding capacity increases with temperature, the acid-gas stream at its discharge pressure would be significantly undersaturated if the ambient temperatures were either 25° or 33° C.
Hydrate curve
Fig. 1 also shows the hydrate curve for pure CO2. The data were obtained by a composite of experimental results6 7 and Aspen Plus (version 12.1) simulations. Independent predictions using the Hysys (version 3.2) hydrate utility also agreed well with the present data, showing a maximum deviation of only about 4%.
From the hydrate curve in Fig. 1, it is apparent that the hydrate formation temperature at a pressure of 215 bara (at pipeline conditions) is around 11.5° C. This value is clearly below the average minimum ambient temperature of 18° C., so hydrates are unlikely to occur.
Interstage temperature, pressure
Careful analysis of Fig. 1 indicates that the saturated water content of the acid-gas stream at a condensing temperature of 43° C. and for pressures between 45-70 bara remains lower than the value at 18° C. and 215 bara by 12-22% (22% corresponding to 60 bara). This aspect is extremely important and demonstrates the ability to operate at a range of compressor interstage pressures, while ensuring that the acid-gas stream remains undersaturated. The curves for 18° and 25° C. do not show this behavior, however. Instead, they indicate a sharp increase in water content when the pressure is above a certain value (the transition occurs at approximately 54.5 bara for the 18° C. curve and at 64.2 bara for the 25° C. curve).
Moreover, the crossover between the curves is an expected phenomena and explained by the fact that below critical temperatures, the pressure required to liquefy a gas decreases with temperature.
In general, the water-saturation capacity of the acid gas at a given pressure is a strong function of temperature. As explained earlier, below the critical temperature of CO2 (~31° C.), small fluctuations in interstage pressures can affect the CO2 phase behavior and, therefore, the water saturation values. For this reason, the interstage temperature control should maintain the third-stage discharge temperature above the CO2 critical temperature.
Another important detail is to ensure that the third-stage compressor discharge pressure is at or near 60 bara. This is because the water saturation curve passes through a minimum at this pressure (for a temperature of 43° C.) and would ensure that the acid-gas stream is undersaturated even at low ambient temperatures.
Effect of hydrocarbons
One potential problem in the design and operation of acid-gas injection systems is the presence of hydrocarbons. In particular, their effects on phase equilibrium and water-content curves require further understanding to ascertain the need for any design modifications.
We therefore compared water-content curves for:
- 100% CO2 (base case).
- 99% CO2 + 1% CH4.
- 95% CO2 + 5% CH4.
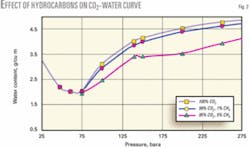
Fig. 2 shows the curves at a temperature of 43° C. Up to a pressure of 75 bara, the presence of hydrocarbons has practically no effect on the water saturation values.
The implication is that the minimum achievable water content of the acid gas (by interstage cooling) is likely to be unaffected. At stage pressures greater than 75 bara, however, the water-holding capacity decreases with an increase in the hydrocarbon concentration.
At 1 mole % CH4, the maximum deviation from the base case occurs at a pressure of 100 bara and is about 5%, which is within the uncertainty limits of the simulated data. At 5 mole % CH4, however, the water content values are lowered by as much as 15% for pressures greater than 75 bara.
This is a potential concern, especially for low-temperature scenarios, in which a further decrease in water content could potentially cause free water to condense in the pipelines. One should therefore perform additional steady-state simulations for extreme cases such as amine flash tank failure in which the hydrocarbon concentrations could be as high as 20-30%.
In general, for the present case, the acid-gas stream to be compressed will have hydrocarbon concentrations less than 0.5 mole %. Any deviation from the base calculations is therefore considered to be negligible.
For instance, the water saturation values calculated for a 99.5 mole % CO2 + 0.5 mole % CH4 stream at 18° C. and 215 bara is 2,423 mg/cu m compared to 2,462 mg/cu m for a pure CO2 stream, indicating that the deviation is less than 1.6%.
Special case
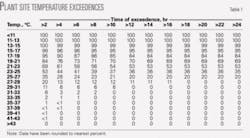
The lowest recorded winter ambient temperature at the project’s plant site is around 6.7° C. and based on data collected from 1982-98. The lowest recorded temperature, however, is merely an instantaneous value that may have occurred for a short time.
Table 1 shows that the duration for which the ambient temperature falls below 13° C. is negligible.
Fig. 1 shows that the water holding capacity of the acid gas at 43° C. passes through a minimum at 60 bara and has a value of 2,021 mg/cu m. Assuming that the acid-gas stream is discharged year round at this specification, no free water would condense in the pipeline as long as the gas temperature is above 11° C. The acid-gas dew point at 215 bara and corresponding to a water content of 2,021 mg/cu m is 11° C.
In reality, on a cold day, the acid-gas water content at its discharge conditions can fall to values well below the 2,021 mg/cu m limit. This is because lower air cooler discharge temperatures, particularly at the second-stage discharge, may be possible when the ambient temperature drops sufficiently.
Preliminary calculations indicate that for an ambient temperature of 18° C., the acid-gas water content at pipeline conditions can be reduced to 890-1,474 mg/cu m. Additional steady-state simulations at extreme low temperature conditions are required to quantify this effect. We therefore concluded that the risk of hydrate formation or free-water condensation due to the occurrence of extreme low ambient temperatures is minimal.
Acid-gas venting
During maintenance, unit shutdown or upset conditions, safe disposal of the acid-gas stream to atmosphere is required. It is anticipated this will normally be required only for short infrequent intervals, typically 3-5 days/year. Several alternatives were considered, including venting to atmosphere and directing to the flare or incineration.
The stream is almost completely CO2 with about 200 ppm (vol) of H2S. There are health and safety issues associated with the direct disposal of H2S and also CO2, especially at higher concentrations).
Some of the specific venting options considered were:
- Venting through the gas turbine exhaust.
- Venting via the AGRU regenerator section off a high point.
- Venting from a standalone stack near the CO2 compression facility.
Gas turbine exhaust venting
This choice was considered because the high temperature and velocity in the turbine exhaust will ensure that the acid-gas stream is buoyant, thereby eliminating any dispersion concerns. Technical discussions with KBR’s machinery and furnaces groups, however, indicated several potential problems, such as risk of explosion due to hydrocarbon contamination, requirement of large line lengths and sizes, and in general avoiding any interference that may have an adverse affect on the overall performance of the gas turbines. This option is not recommended.
An alternate disposal scheme that involved running a vent line up the outside of the gas turbine exhaust stack was also investigated. During turbine maintenance or shutdown, however, there could be a problem of CO2 settling down (backflow) onto the turbine surface. The corrosive nature of CO2 is a concern. This option was not pursued.
AGRU regenerator venting
This option is a more convenient route because the acid-gas stream can be directly vented to atmosphere from a high point off the amine regenerator flash drum. Consequently, atmospheric dispersion calculations were performed to assess the expected ground-level concentrations of H2S and CO2.
These process conditions were chosen for the dispersion calculations: temperature = 42° C., pressure = 2.2 bara, acid-gas composition of CO2 96.0 mole %, H2S 0.02 mole %, H2O 4.0 mole %.
The dispersion calculations were based on a stack size of 1.7-m diameter by 30-m high, and for two cases: 100% and 10% flows. KBR’s environmental group performed the calculations using the EPA SCREEN3 model.
Results indicated that the expected maximum 1-hr average ground-level H2S and CO2 concentrations were 0.08 ppm (vol) and 380 ppm (vol) for the 100% flow case, and 0.04 ppm (vol) and 173 ppm (vol), respectively, for the 10% flow case. These values were significantly lower than the OSHA, NIOSH, and odor permissible limits.
Based on the results from the dispersion analysis, therefore, we recommended this route.
Standalone stack
This option was considered only as an alternative to venting from the amine regenerator and is unnecessary.
Start-up, shutdown venting
During special circumstances-such as equipment failure, start-up, or shutdown-venting of acid-gas pockets from the compression equipment and pipelines may be necessary. These points provide insight into this aspect and are based on operational experience from a KBR designed high-capacity CO2 injection facility and from acid-gas injection plants in Canada:
- Operator experience indicates that the CO2 discharge pipeline is rarely depressurized and, even if required, it is done via small manual vent valves over 24 hr. Another method is to launch a pig to displace the CO2 in the pipeline and collect it at the wellhead. For this option, methane can be used as the purge gas.
- Compressor blowdown is performed via emergency shutdown valves. During blowdown, the compressor inlet-outlet is blocked and venting occurs via 2-3 in. valves. Pressure safety valves should be installed in each compression stage.
- A major concern while venting from machinery is the formation of dry ice (compressor blowdown). This is because the rapid depressurization of the CO2 stream causes a pressure decrease over a constant enthalpy line and may pose the risk of dry ice formation in the compressor internals and pipelines.
Plant experience has shown, however, that due to the high operating temperatures (150-230° C.) of the compressor internals, the heat sink keeps away any liquid or dry ice from forming inside even when the compressor is shut down and is depressurizing. Moreover, a slipstream from the upstream (hot side) of the aftercoolers can be routed through the antisurge valves to keep the discharge gas superheated during any such event. - Extreme low temperatures at the plant site should not be a major concern for start-up; trouble-free operations even at -40° C. have been observed at Canadian injection facilities.
- Automatic N2 purge system is typically used to eliminate sulfur deposition (due to reaction of H2S and elemental O2). Moreover, the N2 purge system also helps to sweep away any water condensed in the compressor discharge lines during shutdown.
For our case, however, due to low H2S concentrations in the acid gas, the risk of sulfur deposition is minimal. We therefore recommended that stainless steel be used for first, second, and third-stage compressor discharge piping and eliminating the N2 purge system. - Depressuring from compressor suction knockout drums is normally not recommended because resulting low temperatures could potentially freeze the lines. There are also hydrate formation and CO2 freeze-out concerns.
CO2 compressor, pump experience
One of the world’s largest CO2 compressors was built for a KBR designed high-capacity CO2 injection facility. It has a suction volumetric flow rate of 37,100 cu m/hr/train and discharges the CO2-rich acid gas from near atmospheric pressures to 203 bara. The compressor is driven by a double-ended 11.7 Mw electric motor.
At the suggested discharge conditions, CO2 is dense and may transfer unstable vibrations to the compressor rotor. To mitigate this problem, the compressor vendor installed an additional damper with a squeeze-film mechanism.
The compressor was also designed to prevent impeller resonance, which is a potential concern at supercritical conditions. Impeller natural frequency decreases as a result of increase in fluid density.
In contrast, our study’s CO2 injection facility requires compressing approximately 140,000 cu m/hr of acid gas from a suction pressure of about 1.8 bara to a final discharge pressure of 215 bara. There is a lack of operational experience at these high volumetric flows using either 1x100%, 2x50%, or 3x33% compression trains.
An independent investigation by KBR’s machinery group confirmed this and concluded that no or little experience existed for the 1x100% or 2x50% compressor configurations. The study indicated, however, that both 4x25% and 3x33% options were technically feasible; the risks associated with a 3x33% were considered manageable.
For the present injection conditions, sufficient experience is available to perform the service using compressors only or a combination of compressors and a dense-phase (CO2) pump. For the current scheme, however, the injection pump should be eliminated unless a significant cost benefit is demonstrated. This is because the pump represents an additional unit operation that increases system complexity. Moreover, eliminating the pump also avoids the need for a CO2 accumulator, which acts as a holding vessel during pump recirculation.
Based on the recommendations of KBR’s machinery study and due to layout and operational considerations, the project team selected a 4x25% compressor-only configuration.
Equipment, pipeline costs
Five design cases were considered for cost comparison purposes:
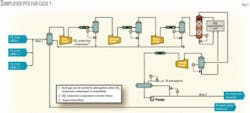
- Case 1, base case. This is a scheme that was developed during the project’s early stages and included a 1x100% compressor configuration, a dedicated triethylene glycol (TEG) dehydration unit, and 2x100% CO2 injection pumps.
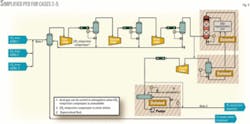
- Case 2, proposed design modifications. This case incorporates design modifications and eliminates the TEG dehydration unit, injection pumps, and the CO2 accumulator. Moreover, a 1x100% compressor configuration allowed a direct cost comparison with Case 1.
- Cases 3-5, alternate compressor configurations. Most of the available compressor experience pertaining to CO2 compression lies at significantly lower flow rates. In addition to Case 2, therefore, cost estimates for 2x50%, 3x33%, and 4x25% compressor configurations were also included.
Figs. 3 and 4 show the simplified process flow diagrams (PFDs) for Case 1 and Cases 2-5.
Total project cost for equipment
Total project cost (TPC) data were generated using vendor supplied quotes for compressors, pumps, and the TEG dehydration unit. For other equipment such as knockout drums and air coolers, the costs were obtained based on capacity factors applied to reference projects.
The validity period of the TPC estimate is 90 days from the original issue date of Apr. 11, 2005, and the accuracy of the estimate is 35%.
Table 2 summarizes the TPC relative to the base case. First, a direct comparison is made between Cases 1 and 2. The data in Table 2 indicates that the TPC for Case 2 is approximately 7.5% lower than the base case. This clearly demonstrates the potential for cost savings by eliminating the TEG dehydration unit and the dense-phase CO2 pumps.
The table also shows that Case 3 has the lowest TPC, whereas costs for Cases 4 and 5 are about 6% and 20% higher than the base case.
It is important to exercise caution while interpreting these results because compressor quotes for Cases 1-2 and Cases 3-5 are based on two different vendors. Because compressor cost is a major portion of TPC, the difference in vendor pricing is likely to influence any direct comparisons between Case 2 and Cases 3-5.
Also, the KBR machinery study cites lack of operational experience at higher flow rates, which was taken into account before making a final design selection.
TPC for pipelines
Table 3 shows TPC for a 5-km long, 12-in. ID pipeline using carbon steel, carbon steel clad with stainless, and stainless steel options. The data are normalized by the TPC of the carbon steel option.
Both stainless steel clad and stainless steel options have significantly higher costs than the carbon steel option. In addition, stainless pipelines have the potential for chloride stress corrosion cracking and are therefore not recommended.
Because acid gas should be undersaturated at pipeline conditions, corrosion due to free water condensation is not a concern. A carbon steel pipeline with a nominal corrosion allowance (3 mm) was therefore considered adequate for the CO2-injection pipeline.
Material selection
Stainless steel and stainless clad is recommended in all wet sections of the CO2 compression plant and, where applicable, NACE compliance was observed. Carbon steel with a 3 mm corrosion allowance was recommended for the fourth-stage compressor discharge piping and also for the CO2-injection pipeline.
More details on the material selection for compressors and other design considerations for acid gas injection are available in the literature.8
Recommendations, conclusions
The following conclusions and recommendations are specific to the gas-processing project under study. Some general insights, however, can be drawn on the design of high-capacity CO2 injection facilities.
Important conclusions are:
- The water content and hydrate curves indicate that the acid-gas stream at its discharge pressure of 215 bara is likely to be undersaturated for all expected ambient temperature scenarios; therefore, dehydration is not required.
- Venting via AGRU regenerators appears to be a convenient option for safe disposal of acid gas during any upset conditions. Dispersion calculations support this route and indicate that the maximum expected ground-level concentrations of H2S and CO2 are well below the regulatory limits.
- Findings of a KBR study indicate that compressors alone can perform the entire injection service.
- Equipment comparisons clearly demonstrate that the present design recommendations, eliminating TEG dehydration and CO2 injection pumps, result in significant cost savings.
- Cost data for the design case (Case 3) using a 2x50% compressor configuration appears to be the lowest. This design, however, is not a preferred option due to the lack of operational experience. Differences in vendor pricing is considered to have influenced the relative cost data provided.
- Pipeline cost comparisons suggest that carbon steel with a 3-mm corrosion allowance is by far much more economical than installing stainless steel/stainless clad piping.
Our recommendations for the design of CO2 injection units are to:
- Eliminate the TEG dehydration unit.
- Eliminate CO2 injection pumps and the CO2-accumulator drum.
- Use stainless steel for first, second, and third-stage compressor discharge piping and eliminate the automatic N2 purge system.
- Use carbon steel with a nominal corrosion allowance of 3 mm for pipelines.
- Adopt a 4x25% CO2 compressor configuration.
- Vent the acid-gas stream from the AGRU regenerators when required.
- Perform additional dispersion calculations for the selected vent scheme to ensure that the acid-gas concentrations at higher elevations remain below acceptable limits.
- Review dispersion issues related to the presence of trace aromatics in the acid-gas stream.
- Install temperature control for the third and fourth-stage compressor discharge coolers.
- Request vendor for a third-stage compressor discharge pressure of about 60 bara; this would ensure maximum water removal from the acid-gas stream.
- Perform additional steady-state simulations to predict if water dropout may occur during situations such as extreme low ambient temperatures and high hydrocarbon concentrations in acid gas.
- Examine dynamic simulations, which may be required to predict if water dropout or dry ice formation concerns exist during transient scenarios.
- Review CO2 phase behavior corresponding to the compressor stage pressures and temperatures.
Acknowledgments
We thank Calvin Spencer of KBR and Ed Wichert of Sogapro Engineering Ltd. for validating the CO2-water saturation curves. Special thanks also to Brian Trybus of KBR and Neil Bosch of Chevron Canada Resources for sharing their in-depth operational and practical experiences.
References
- Weirauch, W., “LNG Spending to Surge,” Hydrocarbon Processing, May 2005, pp. 7-8.
- Clark, M.A., et al., “Designing an Optimized Injection Strategy for Acid Gas Disposal without Dehydration,” presented at the 77th Annual GPA Convention, Dallas, Mar. 16-18, 1998.
- Carrol, J.J., “Phase Equilibria Relevant to Acid Gas Injection: part 1-non-Aqueous Phase behavior,” Journal of Canadian Petroleum Technology, Vol. 41 (2002), No. 6, pp. 25-31.
- Carrol, J.J., “Phase Equilibria Relevant to Acid Gas Injection: part-2-Aqueous Phase behavior,” Journal of Canadian Petroleum Technology, Vol. 41 (2002), No. 7, pp. 39-43.
- “The Water Content of CO2-rich Fluids in Equilibrium with Liquid Water or Hydrate,” GPA Research Report RR-80, Gas Processors Association, Tulsa, May 1984.
- “The Water Content of CO2-rich Fluids in Equilibrium with Liquid Water and/or Hydrates,” GPA Research Report RR-99, Gas Processors Association, Tulsa, May 1986.
- Sloan, D.E., “Clathrate Hydrates of Natural Gases,” Marcel Dekker Inc., 1990.
- Carrol, J.J., and Maddocks, J.R., “Design Considerations for Acid Gas Injection,” Proc. Laurance Reid Gas Conditioning Conference, Norman, Okla., February 1999, pp. 90-116.
The authors
Siva Ariyapadi (Siva.Ariyapadi @Halliburton.com) is a process engineer at Kellogg Brown & Root Inc., Houston, where he has been employed since 2004. During this time, he has been involved in the process design of LNG/gas processing plants. In his current role, Ariyapadi is pursuing technology development activities for the FCC group. He received a BS from Annamalai University, India, an MS from the University of Saskatchewan, and a PhD from the University of Western Ontario, all in chemical engineering.
James Strickland was a process manager at Kellogg Brown & Root Inc., Houston, at the time this article was written. He is currently the manager of process engineering for Black & Veatch Corp., Houston. His areas of expertise include gas processing, treating, and sulfur. Strickland previously worked for Matthew Hall Engineering Inc., Hudson Engineering Corp., and Union Carbide Corp. He holds a BS and MS in chemical engineering from Georgia Tech and an MBA from the University of Houston.
Julio Rios is a senior process manager in the LNG and gas processing group at Kellogg Brown & Root Inc., Houston. His experience includes LNG, gas-to-liquids, gas processing, olefins, coal gasification, and gas treating in the areas of process design, operation, commissioning, and performance/capacity testing of the units he helps design. Rios previously worked for CF Braun & Co., Arabian Petrochemical Co. (Petrokemya), and Scientific Design Co. Inc. He holds a BS from City College of New York and an MS from Manhattan College, New York, both in chemical engineering.
