Model calculates acid-gas injection profiles
Several case studies demonstrate the utility of a new model to determine the acid-gas injection profile from the wellhead to TD.
Injecting acid gas into formations is a cost-effective alternative to sulfur recovery and an environmentally friendly way to reduce greenhouse gas emissions.
The new comprehensive model for the multiphase flow of acid-gas injection provides phase and flow profiles along the wellbore.
Acid-gas injection
With growing environmental concerns, the disposal of small acid-gas quantities is a problem. In the past, producers could flare these acid gases. This, however, is no longer the case.
The disposal method of choice is to compress and inject the gases, usually into a nonproducing formation. Recently, some also have investigated compressed acid gas as a part of a miscible enhanced oil recovery scheme.
The injection profiles from the wellhead to TD are key parameters for designing and operating an acid-gas injection system. An incorrect injection-pressure estimate will have a large effect on the system.
The difficulties of precisely modeling the injection profiles lie in modeling the flow in tubulars and estimating the fluid’s thermodynamic properties. The most important difficulty is to seamlessly combine the fluid and tubular flow models to provide an accurate acid-gas injection model.
Model
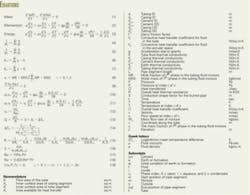
Fluid flow behavior in tubulars is governed by the mass, momentum, and energy conservation laws (Equations 1-3 in equation box).
These three fundamental equations provide the basis for a comprehensive model that illustrates the flow features without the limitations of flow states (steady and transient), fluids (gas, liquids, and multiphase), and tubular orientation. The model also takes into account the bulk modulus, thermal effects (including heat interchange with the surroundings), and the effects of pressure and temperature on fluid properties.
Fluid thermodynamic features affect the model. The fluid properties and even the flow phase may change along the wellbore because of fluid temperature and pressure changes along the wellbore caused by flow, fluid gravity, and heat transfer between the fluid and surrounding formation. A proper model has to account for all these effects.
The analysis mostly considers steady flow in the tubulars. Setting all the partial differentials over time to zero reduces the model to steady flow.
The model sets no limits on the flow direction and tubular segment orientation. It is suitable for either production or injection.
Acid-gas customization
Acid-gas properties change significantly along the wellbore because of temperature and pressure changes. The phase may also change.
The flow model requires many calculations for estimating fluid properties; therefore, a properly defined fluid and phase model is important.
Although many fluid models are available, this analysis uses AQUAlibrium. AQUAlibirum, developed for calculating equilibrium in systems containing acid or sour gas and water, was designed specifically for gas, liquid, and supercritical phases.1-4 This is critical because acid gas often is in a liquid state and supercritical regime during injection. The software, moreover, is a rigorous thermodynamic model rather than being merely empirical.
Another AQUAlibrium advantage is that it provides a smooth transition from the liquid-to-supercritical or vapor-to-supercritical region. Many physical property software packages exhibit a nonphysical discontinuity in the fluid properties when changing from liquid to supercritical. A smooth transition is important for understanding the physics of the injection well and solving the flow equations.
In addition to its accuracy, AQUAlibrium enhances the modeling by:
- Dealing with up to 11 components commonly encountered in acid gases, including water.
- Providing eight-phase properties for each phase: vapor, aqueous, and condensate. This covers all the required fluid properties for thermodynamic modeling.
- Having a sufficient range of pressure and temperature (up to 150 MPa and between -150 and 300° C.) for almost all applications. This is critical for the iterations.
- Providing the enthalpy including the phase change heat that makes the energy conservation correlation more precise.
For the given temperature and pressure, AQUAlibrium provides the mole fraction and properties of each phase.
Equations 4-8 calculate the mixture properties of the multiphase fluids.5 The correlation for the fluid properties covers gas (y0 = 1.0), liquid (y0 = 0.0), and multiphase (0.0
The model for acid or sour gas with water is for multiphase flow in the wellbore tubulars without limits on the flow directions (Equations 9-11). In the equations, the pressure P, temperature T, and the mixture mass flow rate Wm are primary variables. AQUAlibrium calculates the mixture properties according to the composition and flowing conditions (P and T). Equation 12 then can estimate the mixture velocity vm.
The Colebrook-White equation was selected for calculating the friction factor.6
Wellbore heat transfer
Fluid temperature in the wellbore varies with depth and sometimes with time. Temperature affects many fluid properties that influence hydraulic features of flow, such as density and viscosity or even the phase. The model, therefore, should consider the heat transfer from the wellbore fluid to the surroundings.
The fundamental principles of heat transfer can estimate the heat loss from a buried pipeline segment of length L (Equations 13-14).
Fig. 1 shows the thermal resistance diagram for wellbore heat transfer. The overall heat transfer resistance or coefficient, R or U, is the sum of six terms in series:
- Convection due to the fluid flowing in the tubulars.
- Conduction through the tubing.
- Convection through the fluid in the annular space.
- Conduction through casing.
- Conduction through the cement.
- Resistance due to the surrounding earth.
Equation 15 provides the overall heat-transfer resistance and coefficient for this configuration.
The final contribution is the resistance due to the formation. Equation 14 calculates the shape factor for a buried pipe.7
Not all heat-transfer procedures contain all six heat-transfer resistances. A portion of an offshore wellbore may be exposed to convective heat transfer from seawater and ambient air in the riser. Convection can affect significantly the overall heat-transfer coefficient.
Many correlations can estimate heat convection coefficients based on fluid and flow properties. Almost all, however, are expressed in the dimensionless form as Equation 17. In the equation:
- Nu is the Nusselt number, a dimensionless heat-transfer coefficient.
- Re is the Reynolds number, a dimensionless number that combines flow conditions and fluid properties.
- Pr is the Prandtl number, a dimensionless description of the fluid properties.
The Dittus-Boelter equation (Equation 18) is an example of such a correlation.10
In the equation n = 0.4 for heating and n = 0.3 for cooling.
Other correlations are available. The model combines several correlations together for estimating the heat-transfer coefficient in tubular flow for a large variation of Reynolds and Prandtl numbers.
Solutions
Many methods can solve the set of differential equations for a specific tubular with given flowing conditions. This analysis uses an implicit method to solve the model because of its overall conservation balance solution and the lack of a limitation on the solution direction.
The method divides the wellbore into n grids with length Δx. By applying a difference quotient to the central point of each grid, the differential equations, Equations 9-11, are converted to nonlinear algebraic equations (Equation 19). In the equation, the subscript i is the equation index, subscript j is the index of x, and n is the number of grids.
Equation 19 is a system of 3n nonlinear algebra equations with 3(n + 1) unknowns. Three boundary conditions, therefore, must be specified to solve the system of equations.
For the well-flow problem, several conditions can be specified. For example, the equation can determine the wellhead pressure and flow temperature at TD if given the flow rate and temperature at the wellhead and the pressure at TD.
Solving the nonlinear algebraic equations (Equation 19) is a trial-and-error process. The iteration requires initial values, and for the iteration to converge, these values must be close to the solution. This requirement becomes more critical when the model includes complex thermodynamic features of the fluid and the flow phases.
In an application, a precalculation based on a simple model of tubular flow generates the initial pressure and temperature to be calculated at both ends of the tubular. Then the initial pressure and temperature profiles are set linearly with the given settings and calculated initial values at both ends of the tubular.
This analysis selected a pseudo-Newtonian method for finding the solution of the nonlinear algebra equations because of its converging speed and flexibility on the initial values.
A program, called GLEWpro, was developed based upon the models and methods described previously. The program provides accurate acid-gas injection profiles of the wellbore. The following cases demonstrate features of the model.
Kharg Island
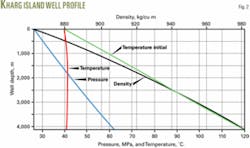
The first example calculates the wellhead pressure and wellbore profiles for an acid-gas injection well off Kharg Island, Iran.8 The well has a string of vertical 6-in. tubing, 4,150 m in length. The maximum anticipated injection rate is 90 MMscfd.
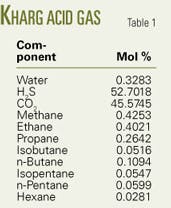
Table 1 shows the acid-gas composition. Estimated sandface pressure is 62.2 MPa and temperature is 120° C. The surface injection temperature is 40° C.
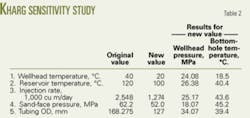
The program calculated the temperature profile along the well using an overall heat transfer coefficient of 1.91 W/sq m-K that was determined from the methods outlined previously. Table 2 shows that the formation contributes 97.66% to the overall heat-transfer resistance and dominates the heat transfer between the tube fluid and formation.
The injected fluid is in liquid phase from the wellhead to the bottom of the well with a calculated wellhead pressure of 26.39 MPa and estimated fluid temperature of 40.9° C. at the bottom of the well.
Fig. 2 shows the pressure, temperature, and density profiles along the well.
Many design considerations and operation conditions influence the calculated wellhead pressure, therefore a sensitive study can provide a better solution (Table 2). This comparison indicated that changes in injection rate affected only slightly the injection pressure.
Anderson Exploration Ltd.
The next three examples are for three acid-gas injections wells operated by Anderson in West Culp, North Normandville, and Puskwaskau fields in Alberta.9 All three wells have 2 3/8-in. tubing.
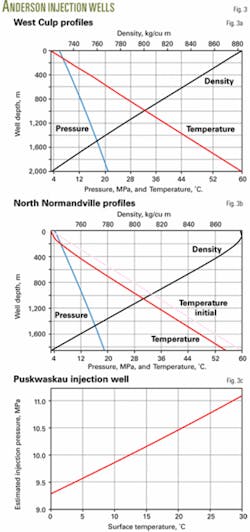
In West Culp the tubing is set at 1,943 m and the acid-gas composition is 60% H2S, 39% CO2, and 1% CH4. For a 0.6-MMscfd injection rate, 5.8 MPa wellhead pressure, 3° C. temperature, the program shows a 21.04 MPa bottomhole pressure, which agrees well with the 20.2 MPa reported in Reference 9.
Fig. 3a shows the calculated pressure, temperature, and density profiles.
In North Normandville field, the injection well is 1,858-m deep. The operator needs to inject 0.08 MMscfd of acid gas, composed of 67% H2S, 32% CO2, and 1% CH4, into the reservoir at 19.014 MPa and 60° C. The wellhead flowing temperature is 3° C.
The program calculated the temperature profile along the well with an overall heat-transfer coefficient of 3 W/sq m-K. The estimated wellhead pressure is 4.19 MPa, which agrees well with the 4.38 MPa reported in Reference 9. The bottomhole flowing temperature is 55.3° C.
Fig. 3b shows the pressure, temperature, and density profiles.
The Puskwaskau well is 2,670 m deep and the operator needs to inject 0.106 MMscfd of acid gas. The acid-gas composition has varied slightly over time but is about 45% H2S, 51% CO2, and 4% CH4. The bottomhole pressure and temperature are 29.5 MPa and 82° C.
For the Puskwaskau well, the program made a series of calculations to determine the effect of surface temperature on injection pressure. The calculations varied surface temperature from 0° to 30° C. (Fig. 3c).
As seen in Fig. 3c, injection pressure increases as surface temperature increases.
Chevron Canada Ltd.
The next three examples are from injection wells operated by Chevron Canada Ltd., in Acheson, West Pembina, and Bigoroy fields in Alberta.10
Injection at Acheson is at a relatively low pressure. The reservoir pressure is about 2.4 MPa. The well is 1,192 m deep and the formation temperature is 49° C.
The acid-gas contains 90.72% H2S, 8.25% CO2, and 1.03% CH4.
The analysis assumed a 2 3/8-in. tubing and estimated injection pressure for three scenarios:
- Linear temperature profile with a 3° C. wellhead temperature and a 49° C. reservoir temperature.
- An isothermal case with a 3° C. fluid temperature throughout the injection string.
- A linear profile for the formation temperature, heat transfer between the well fluid and the surroundings, and an assumed overall heat-transfer coefficient of 20 W/sq m-K.
Table 3 summarizes the three cases.
In this well, the injection remains in a gas phase throughout. This is not surprising because of the relatively low pressure. The estimated injection pressure is only a weak function of the temperature profile.
For comparison, the actual wellhead pressure is around 2.5 MPa. This is significantly higher than the calculated injection pressures for any of the three scenarios outlined previously.
In West Pembina field, the injection well has a 2,810-m depth and contains 2 3/8-in. tubing.10 The bottomhole pressure and temperature are 26.9 MPa and 98° C.
The acid-gas injection rate is 8,000 cu m/d and the mixture contains 3.24% H2O, 55.93% H2S, 38.35% CO2, 1.88% CH4, and 0.6% C2H6. Injection temperature is 37° C.
The program estimated that the flow is liquid and the required injection pressure is 6.65 MPa, which agrees well with the 7.1 MPa reported in Reference 10.
Another important consideration in acid-gas injection design is the behavior of a well in the case of a catastrophic failure, such as a blowout. For emergency preparedness, the design engineer must be able to estimate the acid-gas flow rate from a blowout.
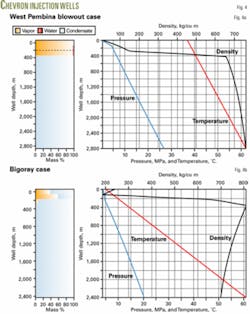
For the West Pembina case, if the flow is open to the air (wellhead pressure at 101.325 kPa) the GLEWpro program will calculate a choked flow with a blowout pressure of 521 kPa and velocity of 290 m/sec at the wellhead. The blowout rate is 23,620 standard cu m/day and the flow changes from a liquid phase to a gas phase at a 300-m depth.
Fig. 4a shows the profiles of the blowout flow.
In Bigoray field, the injection well is 2,394-m deep and also has 2 3/8-in. tubing. The bottomhole pressure and temperature are 20.4 MPa and 61° C.
The operator injects 7,100 cu m/day of an acid-gas mixture consisting of 9.2% H2S, 89.8% CO2, and 1% CH4. Injection temperature is 5° C.
The program estimates an injection pressure of 3.91 MPa, which agrees well with the 4.056 MPa reported in Reference 11. The flow changes from multiphase to fully liquid phase at about 239.4 m, which compares with the 250-m depth given in Reference 10.
Fig. 4b shows the flow profiles.
Other examples
Another example calculation is for an injection well operated by PanCanadian Petroleum Ltd. in Wayne-Rosedale field, Alberta.11
The injection well has a 2 7/8-in. tubing and is 1,926.5 m deep. The injection rate of the acid-gas mixture (20% H2S and 80% CO2) is 21,000 cu m/day. Sand-face pressure is 20 MPa and the bottomhole temperature is 65° C.
When the injection temperature is 20° C., the program calculates a required wellhead pressure of 6.4 MPa, which agrees closely with the actual injection pressure of 6.5 MPa given in Reference 11.
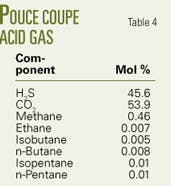
The last example is for a well at Pouce Coupe in Alberta.12 The 1,452-m deep injection well has 2 3/8-in. tubing. Bottomhole pressure and temperature measured in June 2003 were 23.157 MPa and 74° C.
On Apr. 5, 2005, 23,950 cu m/day of acid gas (Table 4 lists the composition) was injected into the reservoir with the wellhead pressure and temperature at 8.3 MPa and 3° C.
By setting the overall heat-transfer coefficient at 3 W/sq m-K, the program estimated a bottomhole pressure of 21.25 MPa and a flowing temperature of 30.3° C.
References
- Carroll, J.J., Natural Gas Hydrate: A Guide for Engineers, Gulf Professional Publishing, Houston, 2002.
- Carroll, J.J., “Phase Equilibria Relevant to Acid-gas Injection Part 2-Aqueous Phase Behavior,” Journal of Canadian Petroleum Technology, Vol. 41, No. 7, 2002.
- Carroll, J.J., “Phase Equilibria Relevant to Acid-gas Injection Part 1-Non-Aqueous Phase Behavior,” Journal of Canadian Petroleum Technology, Vol. 41, No. 6, 2002.
- Carroll, J.J., “The Water Content of Acid-gas and Sour Gas from 100° to 220° F. and Pressures to 10,000 psia,” 81st Annual GPA Convention, Dallas, Mar. 11-13, 2002.
- Hasan, A.R., and Kabir, C.S., Fluid Flow and Heat Transfer in Wellbores, SPE 2002.
- Gregory, G.A., and Fogarasi, M., “Alternate to Standard Friction Factor Equation,” OGJ, Apr. 1, 1985, p. 120.
- Holman, J.P., Heat Transfer, 8th edition, McGraw-Hill, New York, 1997.
- Rahimi, N., and Griffin, P.J., “Potential for Acid-gas Injection at Kharg Island,” SOGAT, Doha, Nov. 22-24, 2004.
- Maddocks, J.R., and Whiteside D., Acid-gas Injection: An Operator’s Perspective, SOGAT, Doha, Nov. 22-24, 2004.
- Bosch, N., “Acid-gas Injection-A Decade of Operating History in Western Canada,” CGPSA Meeting, Calgary, Apr. 16-17, 2002.
- Ho, K.T., et al., “Subsurface Acid-gas Disposal Scheme in Wayne-Rosedale, Alberta,” SPE Paper No. 35848, International Conference on Health, Safety, and Evironment, New Orleans, June 9-12, 1996.
- Eross, J., personal communication.
The authors
Shouxi Wang works for Gas Liquids Engineering Ltd. in Calgary. He has extensive experience in developing software for pipeline network simulation, pipeline leak detection, and engineering applications. Wang holds a BSc in oil and gas storage and transportation, an MSc in mechanical engineering, and a PhD in petroleum engineering from the Southwest Petroleum University in China.
John J. Carroll is the director of geostorage process engineering for Gas Liquids Engineering Ltd. in Calgary. Carroll holds a BSc and Phd in chemical engineering from the University of Alberta, Edmonton. He is a registered professional engineer in Alberta and New Brunswick.
