Permeability changes affect CBM production predictions
The Palmer-Mansoori (P-M) theory of permeability changes incorporated into a pseudosteady-state equation can predict the approximate peak gas flow rate and decline with depletion for coalbed methane wells, when full reservoir modeling predictions are unwarranted.
The predictions formulated in a risk-based model require a range of values for each input parameter and produce a range of gas flow rates. These quick screening model predictions can assess potential gas rates and profitability for various basins, at any stage of the exploration and exploitation process.
The model allows for the prediction of 10% probability (P10) and 90% probability (P90) gas rates,
Risk-based models for hypothetical wells in the Cherokee and Piceance basins illustrate the application.
A useful diagnostic approach first determines, using field data, whether permeability decreases or increases with depletion. This may not be obvious from history-matching production data. But once known, the matching of observed gas production with the model is easier. The permeability loss or gain influences estimates of production rates and reserves, and possibly the selection of infill well sites.
P-M theory
The Palmer-Mansoori (P-M) theory of permeability changes with depletion during coalbed methane (CBM) production includes a permeability loss term (due to an increase in effective stress), and a permeability gain term (due to matrix shrinkage as gas desorbs from the coal).1 Mavor extended this theory to several gas components and also to gas injection.2 Reference 3 summarizes other papers covering permeability changes during CBM depletion.
Equations 1-3 in the equation box summarize the Palmer-Mansoori theory.
Recent conclusions are:3
- With a high initial reservoir pressure, the theoretical permeability rebound should occur with depletion, but with a lower pressure, permeability may increase as soon as depletion starts.
- Literature only confirms permeability increases for the San Juan and Raton basins. The San Juan basin fairway shows large greater than 10 times increases in absolute permeability with depletion.
- Most San Juan basin data are consistent with an exponential increase of permeability with depletion. The basin provides no evidence of permeability decreases.
A useful diagnostic approach first determines, with field data, whether permeability decreases or increases with depletion. This may not be obvious from history-matching production data. But once this is known, the matching of observed gas production becomes easier.
Note that the permeability loss or gain influences estimates of production rates and reserves, and possibly the selection of infill well sites.
Flow rate predictions
The method discussed in this article for rapidly predicting the effects of permeability loss or gain on CBM production is based on the real-gas pseudopressure formulation for gas production but with permeability varying with pressure (from the P-M equation), as well as with viscosity and gas compressibility (Z) factor. Equations 4-9 are the basic equations for gas flow for both vertical and horizontal wells.
Equations 6 and 7 express the radial gas flow rate under a pseudosteady-state approximation, where mk is a modified pseudopressure. With Equations 6-7 and 1-3, the model can predict how gas flow rates vary with drawdown and depletion in CBM wells when permeability changes occur.
Note that ko, in the expressions for Ck, is the original reservoir permeability and is constant. Thus Ck should remain constant if skin (S) does not change during production.
These equations assume that most dewatering has occurred and the well is at the peak gas flow rate and has minimal relative permeability effects.5 13 This usually occurs without much depletion, unless the coals are substantially undersaturated.5 Thus, the modeling discussed in this article only applies to peak gas flow rate and the following decline.
Note that the predicted gas flow rates will likely be overestimated because of residual relative permeability, but this effect should not be large. If a coal seam is undersaturated, the initial pressure (and flow rate) would be the lower reservoir pressure at which the coal becomes saturated.
The predictions are functions of depletion, not time. Including time would require a material-balance calculation, which is not discussed.
The model risk-weights the predictions in that input variables are specified by a range, such as minimum, most-likely, and maximum. The model outputs gas flow rate based on a Monte Carlo solution from hundreds of runs.
Cherokee basin
The Cherokee basin coals are shallower than San Juan basin coals (Table 1) and gas flow rate forecasts would benefit from permeability change predictions.
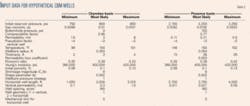
In Table 1, the 1/b term is the pressure at a sorption strain of 0.5 Co due to matrix shrinkage. This value determines the sorption-strain shape with pressure, which generally is the same shape as the isotherm.6 In the example, the 1/b = 371 psi for the Cherokee basin is based on a coal sample isotherm in a Kansas well near the Oklahoma border.7
Co is the sorption strain at infinite pressure after it increases to a plateau during adsorption. Co should track gas content. Gas content increases with coal rank, at least for coals between high-volatile A bituminous coal (HVA) and low-volatile bituminous coal (LV).
In the Cherokee basin, with its HVA coals having a 150-330 scf/ton gas content,7 8 Co should be less than in the Colorado part of the San Juan basin (~500 scf/ton).
The basin also should have a lower Co because of lower reservoir pressure (400-800 psi using 0.4 psi/ft). These shallower coal seams have less gas adsorbed.
Despite these differences, this study for the Cherokee basin uses the same matrix shrinkage parameters Co and 1/b as in the San Juan basin,3 basically because of the large uncertainties in initial porosity (φo).
The P-M permeability increases in the Cherokee may be too optimistic because Co is somewhat high. The ranges for Young’s modulus and Poisson’s ratio shown in Tables 1 and 2 are representative.3
Some of the assumptions used to illustrate gas flow rate calculations with a risk-based model during depletion of a hypothetical well include:
- Well and reservoir parameters as shown in Table 2.
- Initial 800-psi reservoir pressure for both vertical and horizontal wells, corresponding to a deeper well, based on Po~0.4 psi/ft.7
- Constant 0-psi bottomhole flowing pressure after unloading the well.
- Wells drilled on 160-acre spacing in a coal seam having a mean thickness of 3 ft ±1 ft.7
- Assumed initial horizontal permeability (kh) of 3 md mean and 1.5 to 6 md range.
- Hydraulically fractured vertical well with a -3 equivalent skin and 8.5-in. diameter.
- Hypothetical 2,000-ft long horizontal well with an 8.5-in. diameter wellbore, a vertical permeability (kv) = 0.1, 0.3, 1.5 md and a kh = 1.5, 3, and 6 md, the same as for the vertical well.
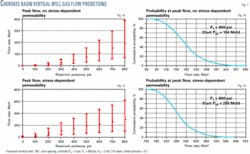
Figs. 1a and 1b show calculated gas flow rates without permeability changes (constant permeability), and Figs. 1c and 1d show gas rates with permeability changes.
For a dry coal, the gas flow rate will decline from the start, the flow will experience small relative permeability effects, and the prediction in Fig. 1a at initial reservoir pressure corresponds to the well brought on line.
A wet coal often requires a dewatering period that includes increases in gas production followed by a decline. The relative permeability effects should become small at the gas peak,5 13 and the prediction in Fig. 1a at initial reservoir pressure will correspond to the time of peak gas production. Depletion is generally small during dewatering for a saturated coal.5
Figs. 1a and 1c show the gas rates at 100-psi increments as the reservoir depletes for cases without and with permeability changes. A comparison of Figs. 1a and 1c indicates that permeability changes enhance gas production throughout reservoir depletion because gas production does not decrease at early times due to permeability loss. This can happen in low-pressure reservoirs as discussed previously.9 10
The most likely P50 peak gas rate without permeability changes is only 65% as great as the peak rate with permeability changes (184 vs. 280 Mcfd). Furthermore, the gas rate at final depletion is much less for the constant permeability case (2.8 vs. 22 Mcfd).
With no permeability changes, gas flow rate declines by a factor of 65, as compared with the case with permeability changes where gas flow rate declines by a factor of 13.
Figs. 1a and 1c indicate that at a given depletion pressure the ranges of predicted gas rates are substantial. This reflects the input parameter ranges assumed in Table 2.
Figs. 1b and 1d show actual probability distributions of the gas rates at initial reservoir pressure (800 psi) for the cases without and with permeability changes. Figs. 1a and 1c give error bars at P0 and P100 levels and Figs. 1b and 1d provide P10 and P90 values that quickly and easily indicate the uncertainties in gas flow rate predictions.
In the horizontal well case, the most likely ratio of kv/kh is 0.1. This ratio is typical for coals but may be lower in the San Juan basin with its prevalent shale stringers. The model can investigate easily the effect of vertical permeability on gas flow rate, however, by varying the mean kv.
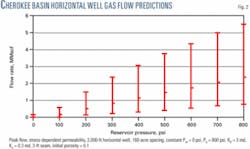
Fig. 2 shows gas flow rates with permeability changes for a horizontal well. As in the vertical fractured well case, relative permeability effects become small at the gas peak in the case of wet coals and the prediction (Fig. 2) at initial reservoir pressure will correspond to peak gas production. A comparison of Figs. 1c and 2 shows that the peak 2.4-MMcfd gas rate for a horizontal well is eight times greater than the 0.3-MMcfd peak for the vertical fractured well. The advantage of a horizontal well, however, should become less with a lower vertical permeability.
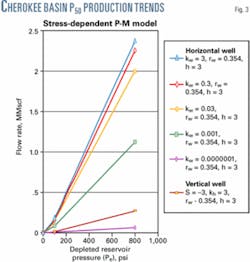
In Fig. 3, note that for kv/kh down to 0.01, such as kv = 0.03 md, gas rate decreases less than 15%. For kv/kh = 0.00033, such as kv as low as 0.001 md, gas rates falls by ~50%, but rates are still four times greater than for the fracture-stimulated vertical well.
For the extreme case of kv= 0.000001 md, a horizontal well has lower gas rates than a vertical well.
In summary, a 2,000-ft horizontal well with zero skin producing from a 3-ft coal seam appears to have much better gas flow rates than a vertical fracture-stimulated well with a -3 skin, even if kv/kh is as low as 0.0001.
The reduction of vertical permeability due to shale stringers, etc. appears not to have a practical consequence on gas flow rates from thin coal seams. For thicker coal seams, such as 20 ft, however, vertical permeability effects are more pronounced. For instance, for kv/kh = 0.0001, the reduction in gas rate (compared with kv/kh = 1) is about 65% for a 3-ft coal seam but is about 90% for a 20-ft coal seam.
Diagnostic approach
The diagnostic approach provides a quick way to see if permeability is decreasing or increasing in the field. With this knowledge, we can better attempt to match observed gas production.
The following illustrates the diagnostic approach for a vertical fracture-stimulated well, but the approach also applies to a horizontal well.
Equation 10 and 11 are the basis for the diagnosis.
In Equation 11, the effective permeability to gas (kav) is the volumetric average of k(r). This depends on the radial variation of pressure, via the P-M equation, and therefore on average reservoir pressure (Pb) and bottomhole flowing pressure (Pw). Note that Pb is usually within 10% of the pressure at the drainage radius. Thus if kav is changing in the field during depletion, Cp should change to reflect this, assuming all other variables in Equation 11 remain the same.
If relative permeability effects cause kav to change, Cp should reflect this too. Since relative permeability effects are assumed small (such as during periods after dewatering and after the peak gas), the Cp measured from well performance using Equation 11 should approximately follow the kav trend caused by P-M permeability changes. Thus Cp, obtained from field parameters, graphed against depletion will reveal permeability changes.
With limited depletion, Cp may decrease initially, due to stress-dependent permeability, but with more depletion it can increase as a result of matrix shrinkage. Thus Cp usually reflects the permeability trend in the P-M equation, as it varies with depletion via Pb.
The pressure Pw near the wellbore generally has only a small effect on kav and Cp. If, however, Pw drops suddenly from effects such as installation of a compressor at the wellhead, Cp may depart from the permeability trend. Cp may also depart from the permeability trend if a workover improves the skin in Equation 11.
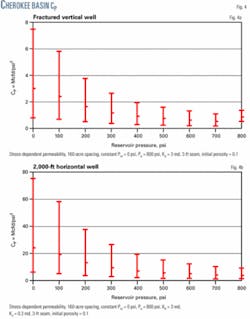
For the representative Cherokee well, Fig. 4a illustrates the results after applying the diagnostic tool to values of q and Pb from Fig. 1c in Equation 10 to calculate Cp as a function of depletion. Cp increases for all depletions and reflects that permeability gain by matrix shrinkage dominates permeability loss by stress-dependent permeability.
The approach also works for horizontal wells. Fig. 4b shows Cp vs. reservoir pressure corresponding to the gas flow rate results of Fig. 2. The overall Cp increase, for instance the ratio of Cp at end to Cp at start, is about the same for both the horizontal and vertical wells. This ratio is ~8. The permeability changes, however, may be overestimated for the Cherokee basin and 8 may be somewhat high.
The disgnostic tool requires using Equation 10, to make field calculations of Cp at different depletions. In the equation q is the gas flow rate and Pb and Pw must be known reasonably well. Downhole pressure gauges can measure Pw directly, or if unavailable, water levels in the casing right after a well is shut in may provide an estimate of Pw, if production is through tubing. Another way for estimating Pw is from surface pressures and frictional pressure calculations in the tubing or casing. The best way to determine Pb is by having a monitor well that is not producing. One can determine Pb from the plateau buildup pressure of a shut-in well, but this takes a long time (~1 month) due to gas readsorption. A third way is by using cumulative gas produced to back-calculate reservoir pressure knowing the sorption isotherm.
After the diagnostic tool is used to determine if permeability changes occur during depletion, one can try to match the field-derived Cp with the model. By varying the P-M parameters and other well and reservoir parameters, one can adjust the model Cp results (Figs. 4a or 4b) until they match field data. This retains the advantage of the error bars in understanding the uncertainties.
Piceance basin
The Piceance basin is deeper (>5,000 ft), with higher reservoir pressure (Table 1). The coal should have a high gas content because the coal rank is high,11 16 and reservoir pressure is high, assuming a normally pressured coal. One would, therefore, expect Co and 1/b similar to those in the San Juan basin, where gas content is ~500 scf/ton.
For gas rate predictions in the basin, however, the illustration assumes the input variables as listed in Table 2 and the same P-M parameter ranges (φo, E, v, b, and Co) as for the Cherokee basin (Table 2), so that the two cases are easier to compare.
Porosity in the Piceance basin is uncertain. The permeability range is from estimates of field data,14 and the permeabilities are 10 times lower (0.11-0.5 md) than in the Cherokee basin (1.5-6 md) because the coals are deeper. The hypothetical net coal thickness of ~26 ft for the Piceance, however, is much greater than the mean seam thickness of ~3 ft in the Cherokee basin. The illustration assumes a constant bottomhole flowing pressure of 100 psi after unloading of the well.
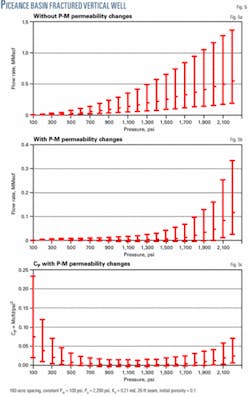
Fig. 5a shows the results for a vertical fracture-stimulated well with no permeability changes. The gas rates are higher (~500 Mcfd peak) than corresponding rates modeled for the Cherokee basin in Fig. 1a (~200 Mcfd peak).
When permeability changes are included in Piceance, Fig. 5b shows that gas flow rates are much less than for the case without permeability changes (~120 Mcfd peak). This behavior is contrary to the Cherokee basin (Figs. 1a and 1c).
For the hypothetical well in the Piceance basin, the permeability changes indicate that P50 gas rates could become less than 25 Mcfd after only a 400-psi depletion.
Applying the diagnostic approach, Fig. 5c shows Cp vs. depletion for the Piceance case with permeability changes. The figure clearly indicates that Cp decreases at early depletion but increases later. The permeability rebounding after initially falling is in contrast to Fig. 4a for the Cherokee basin, where Cp only increases with depletion. This behavior has been discussed previously.9 10 Cp or average permeability tends to rebound in high-pressure reservoirs but has a continuous increase with depletion in low-pressure reservoirs.
Powder River basin
For CBM reservoirs with very low gas content, such as the Powder River basin (~50 scf/ton),17 the permeability increase due to matrix shrinkage will be small because the coal does not have much gas adsorbed.
Although permeability decrease due to stress-dependent permeability could still affect gas flow, this effect will be minimal because the coals are shallow and initial reservoir pressure is low. Which effect (matrix shrinkage or stress-dependant permeability) is greater may depend on the input P-M parameters that are not well known.
Changes in permeability may be moot anyway because of the large 100-1,000 md permeabilities at least in thick shallow coals.17
Acknowledgments
The platform of the risk-based model, StressMan, was designed while the authors were employed with Amoco Corp. and BP PLC. BP is thanked for providing the license for the use of StressMan.
References
- Palmer, I.D., and Mansoori, J., “How permeability depends on stress and pore pressure in coalbeds: a new model,” SPE Reservoir Evaluation and Engineering, December 1998, p. 539.
- Mavor, M.J., and Gunter, W.D., “Secondary porosity and permeability of coal vs. gas composition and pressure,” Paper No. SPE 90255, SPE ATCE, Houston, Sept. 26-29, 2004.
- Palmer, I.D., “Permeability Changes in a CBM Reservoir during Production: an Update, and Implications for CO2 Injection,” Paper 0403, International CBM Symposium, Tuscaloosa, Ala., May 3-7, 2004.
- Ramaswamy, G., “Production history provides CBM insights,” OGJ, Apr. 2, 2001, p. 49.
- Seidle, J.P., “A numerical study of coalbed dewatering,” Paper No. SPE 24358, Rocky Mountain Meeting, Casper, Wyo., May 18-21, 1992.
- Levine, J., “Model study of the influence of matrix shrinkage on absolute permeability of coal bed reservoirs.” Gayer, R., and Harris, I. (eds): Coalbed Methane and Coal Geology, Geological Society Special Publication No. 109, 1996, pp. 197-212.
- Lombardi, T.E., et al., “Western interior coal region gas resources evaluation: core hole results,” Paper 430, International CBM Symposium, Tuscaloosa, Ala., May 3-7, 2004.
- Cardott, B.J., “Introduction to coal geology of Oklahoma,” Fourth Annual Oklahoma Coalbed-Methane Workshop: Oklahoma Geological Survey, Open-File Report 9-2002, pp. 34-55, 2002.
- Mavor, M., and Vaughn, J., “Increasing permeability in the San Juan basin Fruitland formation,” International CBM Symposium, Tuscaloosa, Ala., May 12-13, 1997.
- Shi, J.Q., and Durucan, S., “Changes in permeability of coalbeds during primary recovery-Part 2: model formulation and analysis,” Paper 0342, International CBM Symposium, Tuscaloosa, Ala., May 3-7, 2003.
- Scott, A.R., et al., “Geological and hydrological factors affecting coalbed methane producibility in the San Juan, Greater Green River, and Piceance basins,” World Coal CBM Supplement, January 1996, pp. 6-10.
- Joshi, S., Horizontal Well Technology, Tulsa: PennWell Corp., 1991.
- Seidle, J.P., “Long-term gas deliverability of a dewatered coalbed,” Paper No. SPE 21488, JPT, June 1993, pp. 564-69.
- McKee, C.R., et al., “Stress-dependent permeability and porosity of coal,” Paper 8742, Coalbed Methane Symposium., Tuscaloosa, Ala., November, 1987.
- Dake, L.P., Fundamentals of Reservoir Engineering, New York: Elsevier, 1978.
- Murray, D.K., “Natural gas from deep coalbeds: a promising resource of worldwide importance,” Paper 0335, International CBM Symposium, Tuscaloosa, Ala., May 3-7, 2003.
- Montgomery, S., “Powder River basin, Wyoming: an expanding coalbed methane (CBM) play,” AAPG Bulletin, Vol. 83, No. 8, August 1999, pp. 1207-22.
- Ramurthy, M., et al., “Analysis of the Success of Cavity Completions in the Fairway Zone of the San Juan Basin,” Paper No. SPE 55603, SPE Rocky Mountain Regional Meeting, Gillette, Wyo., May 15-18, 1999.
The authors
Ian Palmer is a consultant in coalbed methane, sand prediction, compaction, subsidence, hydraulic fracturing, and general geomechanics with Higgs-PalmerTechnologies LLC, Houston. He previously worked for BP PLC as a geomechanics specialist and for Amoco Corp. as a specialist in CBM completions. Also he has worked for the National Institute for Petroleum and Energy Research, University of Arizona, Oral Roberts University, and Los Alamos National Laboratories. Palmer has a BS and PhD from the University of Adelaide, Australia. He is an SPE member.
John Cameron is a consultant at PCM Technical Inc. in Tulsa where he works on well completions and production assessment, coalbed methane, sand prediction, geomechanics, and fracturing materials. Previously he worked at Amoco EPTG in Tulsa. Cameron has a BS in mathematics and MS in chemical engineering from Ohio State University and a PhD in chemical engineering from the University of Michigan. He is a registered professional engineer.
Zissis A. Moschovidis is a cofounder and consultant at PCM Technical Inc. in the areas of geomechanics, wellbore stability, cuttings injections, hydraulic fracture propagation, and finite element modeling. He previously worked at the Amoco Research Center and the structural analysis department of Ford Motor Co. Moschovidis has a degree in civil engineering from the National Technical University of Athens, Greece, an MS in structural engineering from the Imperial College of Science and Technology, London, and a PhD in engineering mechanics from Northwestern University. He is a registered engineer in Oklahoma, Michigan, and Greece and is a member of SPE.
