LEAK-DETECTION SYSTEMS - CONCLUSION: Leak-detection efficiencies gauge system effectiveness
Philip S. Carpenter, Serrano Services & Systems, Leander, Tex.
Morgan Henrie, MH Consulting Inc., Anchorage
Ed Nicholas, Nicholas Simulation Services, Wichita, Kan.
All decisions to make significant changes to the effective threshold for an existing pipeline leak-detection system (PLDS) should consider the larger context. Engineers must be aware of political sensitivities, as well as regulations that may include requirements for a leak-detection system or may specify minimum leak-detection capabilities.
This second of two articles defines the various efficiencies that must be considered to gauge PLDS performance effectively. Part 1 examined performance mapping and presented details of a case study.
PLDS efficiencies
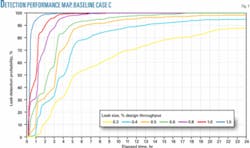
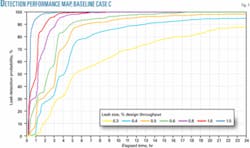
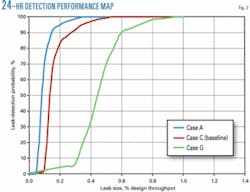
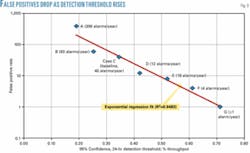
Figs. 1-3 define the performance of the PLDS in terms of detailed maps that show the probability that the PLDS will detect small leaks of specified size as a function of time and the rate at which the system will create false alarms in absent an actual leak. Unfortunately, although the maps detail system performance, they do not-in their present forms, at least-easily address certain questions:
- How effective is the PLDS at detecting the leaks one can actually expect to experience? If the effective threshold is set so high that the majority of leaks will never be alarmed, the value of the leak-detection system should be questioned.
- How useful are the alarms created by the leak-detection system? If most alarms are false positives, the value of any randomly selected alarm is low, again bringing the value of the PLDS into question.
- How does one balance the tradeoff between high leak-detection sensitivity (low threshold) and low numbers of false positives (high threshold)? There should be a way of finding an optimum threshold setting for the system.
null
null
null
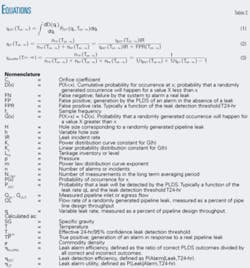
Three efficiencies for the application of a PLDS to a particular pipeline address these questions. These efficiencies (defined mathematically in Tables 1 and 2) are:
1. Leak-detection efficiency, ηDET(T24-hr): This is the probability that a randomly selected leak occurring on the protected pipeline causes the PLDS to alarm. This efficiency is designed to address the issue of detection sensitivity and is assumed to vary as a function of the effective 95% confidence, 24-hr leak-detection threshold, T24-hr. It should be as high as possible.
2. Alarm utility, ηUT(T24-hr): The alarm utility is the probability that a randomly selected PLDS alarm corresponds to an actual leak. It is defined as the total number of true positives divided by the sum of the true positives and false positives Type I errors. A high alarm utility implies a low false-positive rate. This too efficiency should be as high as possible.
3. Alarm efficiency, ηALARM(T24-hr): This is a measure of how often the PLDS alarms properly with respect to all possible critical outcomes of the system, including false negatives Type II errors. It is defined as the number of true positives divided by the sum of the true positives, false positives, and false negatives. Assuming that the true positives and the errors are weighted equally, the maximum value of this efficiency theoretically establishes an optimum leak-detection threshold.
null
null
Completely defining the PLDS requires only two of the three defined efficiencies, since the third can be defined in terms of the other two. Calculating all three, however, can offer insight into the performance of the system, particularly if the trend of the efficiencies appears as a function of effective PLDS threshold.
Leak-detection efficiency
Equation 1 (see accompanying equation box) calculates leak-detection efficiency, ηDET(T24-hr). This measures the probability that the PLDS-configured to a particular effective threshold, T24-hr-will alarm in the presence of an actual leak. This parameter requires that the user not only use the performance analyzer to develop an understanding of the PLDS capabilities in terms of its sensitivity (expressed with the probability of detecting a leak PDET as a function of leak rate qL for each threshold configuration in the range of interest), but also determine the probability of experiencing an actual leak of a particular size, making it the most difficult of the PLDS efficiencies to calculate.
The case study illustrated here used the US Office of Pipeline Safety database of liquid pipeline hazardous liquid accident data for January 2002 to yearend 2005. The OPS’ database includes entries for cross-country liquid pipeline pinhole leaks, punctures, and ruptures, as well as the size in inches of all punctures and ruptures, but not that of pinholes.
This analysis treated all puncture diameters and longitudinal rupture lengths as roughly comparable for leak-size estimating purposes. It also assumed that all pinholes are less than 1-in. in diameter. Hole size categorized the data for purposes of analysis and developing a probability distribution.
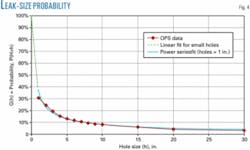
Fig. 4 shows the probability, G(h), that a randomly selected hole associated with a pipeline leak will be larger than a specific size, h. This probability declines as a function of hole size. The analysis showed that, for holes greater than 1-in. in diameter, this probability is well approximated by the power law distribution G(h) = K1hm, where G(h) is the probability function, K1 and m are constants, and h is the hole size.
Since the database does not discriminate between the large number of holes that are less than 1-in. (roughly 60 to 70% of the total using our assumptions), a simple linear extrapolation (G(h) = 1 - K2h) was applied.
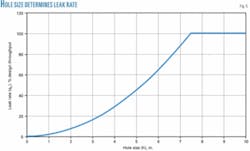
What this analysis requires, however, is the probability distribution for the leak rate (Equation 1). Transforming the hole-size distribution to a leak-rate distribution requires assuming that the leak rate, qL,is calculated as a function of operating pressure (p) and hole size (h) by an orifice equation, as shown in Table 2. The leak flow this equation establishes varies with the square root of the pressure.
Integrating and averaging the orifice equation across the range of normal operating pressure and simplistically assuming that the pipeline pressure is uniformly spread across this range yield an average operating pressure equal to the minimum normal operating pressure plus 67% of the pressure range (assuming also that the leak rate will limit at the normal design throughput of the pipeline).
Fig. 5 shows the resulting predicted variation of the leak rate with hole size.
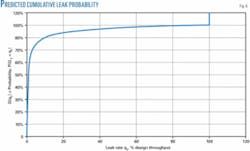
Knowing the cumulative probability that a leak will have a certain size (by calculating D(h) = 1 - G(h) in Fig. 4) and also knowing the correspondence between the hole size and the leak rate from Fig. 5 allow calculation of the cumulative probability, D(qL), for the leak rate itself (Fig. 6).
Fig. 6 shows that roughly 10% of leaks will correspond to ruptures with a leak discharge on the order of the size of the design throughput of the pipeline. More importantly for this analysis, it also indicates that nearly 50% of leaks will be less than 1% of the design throughput.
Solving Equation 1 calculates leak-detection efficiency, ηDET(T24-hr). The leak rate, qL, offers the basis for numerically calculating the derivative of the cumulative probability distribution. Assuming a configuration that produces a specific 95% confidence threshold (T24-hr), this derivative is multiplied by the probability of detecting the leak (PDET) for that threshold configuration as a function of leak rate.
Integrating the resulting function for the range (qL) from 0 to 100% of throughput supplies the leak-detection efficiency for the specified threshold. Varying the threshold by changing the PLDS configuration can supply the leak-detection efficiency for a new threshold, T24-hr. Repeating this process for a range of thresholds calculates the efficiency as a function of threshold.
Leak, alarm utility
Equation 2 uses the leak-detection efficiency to calculate the leak utility, ηUT(T24-hr). This requires estimates for the false-positive rate (FPR) as a function of the PLDS leak-detection threshold and the leak incident rate (IR). The results of the performance analyzer provided the first of these (Fig. 3). Historical records supply the leak-incident rate.
The incident rate for this pipeline is 4.5 x 10⁻⁴ incidents/mile/year, or 0.16 incidents/year (6.25 years between leaks). This frequency agrees roughly with the incident rate for cross-country liquid pipelines in the US based on the analysis of the OPS incident data for 2002-05 (4.2 x 10⁻⁴ incidents/mile/year).
Analysis of high and low incident rate values of 0.04 (25-year recurrence) and 0.64 incidents/year (1.56-year recurrence) provided sensitivity gauging. Equation 3 calculates alarm efficiency, ηALARM(T24-hr), once the leak-detection efficiency and leak utility are both known.
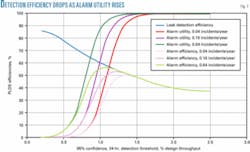
Fig. 7 shows results for all three efficiencies plotted as a function of 95% confidence threshold. Not surprisingly, the leak-detection efficiency ηDET(T24-hr) is highest for low threshold value and declines continuously as the threshold is raised. For the current effective 95% confidence threshold of 0.35% of design throughput, the PLDS is highly sensitive: It will detect nearly 84% of leaks in this pipeline system.
This high detection efficiency, however, comes at a significant cost in false positives. The alarm utility for this PLDS configuration is only 0.34%, causing the users to wade through 294 PLDS alarms to identify correctly the lone actual leak discovered by this system. This is an extremely high overhead in terms of extra control center diagnostic time or field callouts needed to determine whether the leak alarm is a true positive.
Alarm efficiency
The degree to which the alarm is correct in terms of both false positives and false negatives, or alarm efficiency, is also only 0.34%. Even raising the assumed incident rate to 0.64 incidents/year-a level likely at the high end of the range of leak incidents for developed-world pipeline systems-only increases the leak utility and alarm efficiency values to 1.3%.
As the 95% confidence threshold T24-hr is raised, leak-detection efficiency declines because the system fails to capture an increasing proportion of leaks that are less than the leak-detection threshold.
Fig. 5, however, indicates that this is accompanied by a beneficial increase in alarm utility, ηUT(T24-hr), as the number of false positives rapidly declines. The utility asymptotically approaches a value of 100% as the false-positive rate falls to zero, indicating that for a sufficiently high threshold, virtually every alarm from the PLDS is meaningful in that it has a very high likelihood of correlating with an actual leak. At these levels, operators can confidently call for field action knowing that the nature of the event justifies the cost of callout.
Alarm efficiency, ηALARM(T24-hr), however, tells a slightly different story. Since this efficiency addresses not only false positives but false negatives, it initially tends to rise with increasing threshold as the number of false positives declines. It eventually peaks, however, and begins to decline as the failure to detect increasing numbers of actual leaks that are less than the system threshold begins to attenuate the true value of each alarm in a different way.
This measure maximizes the value of the PLDS alarms for an effective leak-detection threshold somewhere between 1.0% and 1.4% of design throughput, depending on the assumed value of the incident rate (IR). The nominal value of 0.16 incidents/year places the threshold of leak alarm efficiency at 1.2% of design throughput.
Comparison
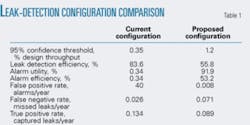
Table 1 shows a comparison of performance efficiencies for the current and proposed threshold configurations for the PLDS as applied to the studied pipeline. Although the current configuration has a high leak-detection efficiency, this comes at a high cost in terms of false alarms, low alarm utility, and low alarm efficiency.
Raising the effective threshold to 1.2% from 0.35% of design throughput reduces the leak-detection efficiency by roughly 33%, so that it falls from a leak-event capture rate of about 84% to 56%. The accompanying reduction in false positives to less than 0.01 alarms/year from about 40 alarms/year, however, raises the confidence that each alarm corresponds to an actual leak to nearly 92% from much less than 1%.
Raising the effective threshold also raises the efficiency with which each alarm captures leak events without error to a maximum of more than 53% from near zero, suggesting that the operator may wish to consider raising the threshold.
The analysis presented here could extend to address a cost-based approach to the problem of assessing and optimizing PLDS performance.
In this example, for instance, it may not be automatically clear that a reduction in leak capture rate to 56% from 84% represents an improvement in performance, even if the false-positive rate is dramatically reduced, as shown above. This analysis pessimistically assumes that control center personnel cannot correctly distinguish between false and true positives. This may or may not be true. Unfortunately, the ability of the “human in the loop” to do this for a PLDS is generally unknown due to lack of research and testing in the human factors arena.
The diligence that personnel may use in performing such an analysis on the fly when it is clear in advance that only one in several hundred such alarms actually corresponds to a leak is certainly debatable, and the costs associated with the alarm analysis may be significant. Barring such capability, only a field callout can validate a PLDS alarm, and this, too, comes at a cost.
