IN-LINE INSPECTION-Conclusion: Tool performance, corrosion data drive POE approach
Richard McNealy, Ming Gao, Ravi Krishnamurthy, Roger McCann, Blade Energy Partners, Houston
Gopala Vinjamuri, Blade Energy Partners, Woodbridge, Va.
The practical application of a probability-of-exceedance approach within an integrity-management program assumes the availability of two important data sets: in-line inspection tool sizing performance and corrosion growth rate.
This concluding article of a two-part series details the importance of these data in implementing a structured probability-of-exceedance (POE) approach to pipeline integrity management.
The first article (OGJ, Apr. 17, 2006, p. 64) provided an overview of the POE approach.
Tool-sizing performance
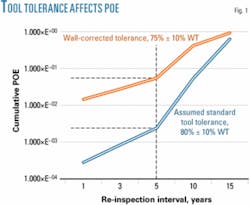
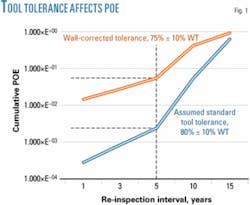
Changes in the confidence of sizing tolerance can significantly affect the probability of a flaw size exceeding the limit state before the prescribed re-inspection interval of 5 years. Better-than-expected tool performance, on the other hand, can result in economic benefits by reducing the frequency of required repairs.
Calculation of the cumulative POE for an example pipeline segment with varying tool tolerance confidence (80% ±10% WT assumed vs. 75% ±10% WT actual; Fig. 1) argues powerfully for the need for quantifying actual performance for each in-line inspection.
Literature provides the methodologies used for validating ILI performance.1-3 API 1163 recognizes these methodologies as determining if an ILI tool is performing within stated (or assumed) sizing specifications, in which several locations are excavated and the ILI measured depths compared with the actual depths.4
Approaches for determining the quantity of performance-validation measurements follow.
Comparing the ILI measured depth with the field measurement for the same feature validates tool performance. Considering field measurement tolerance = ±∆Field, allows computing total tolerance =. This becomes the tolerance used for the success-fail evaluation within an expected ILI tolerance (e.g., ±∆ILI = ±10% WT).
When field-measured depth is within the total tolerance, it confirms a validation success. Otherwise it verifies a failure. The proportion of successes gives a measure of the accuracy of the ILI tool’s predicting corrosion depth. The quantity of validation excavations (sampling size) comparison with a large population becomes a concern for making a definitive conclusion.
Theoretically, an interested party could excavate all ILI reported features to determine if tool performance is within specification, implying 100% confidence in the uncertainty. This is impractical. A small sample of a large population requires that the certainty of meeting the total tolerance be evaluated considering an appropriate validation confidence level.
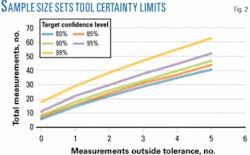
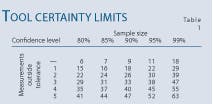
Fig. 2 and Table 1 show the required sample size (quantity of measurements) as a function of the target confidence level and incidence of out-of-tolerance measurements. API 1163 describes a way to determine the lower and upper limits of the ILI tool certainty with a relatively small random sample of a population for a given validation confidence level.
For example, consider a sample size of 25 with 17 measurements within the tool tolerance. The lower and upper limits of ILI tool certainty are 50% and 86%, respectively, at a validation confidence level of 95%. The validation concludes with 95% confidence that the ILI certainty is between 50% and 86%.
Brown and others discuss ways of calculating the confidence level, based on the quantity of measurements and incidence of failures (outside of the specification) for a given certainty, that can be applied to tool performance validation.3-5
Fig. 2 illustrates the validation confidence levels, calculated with these methods. These levels increase with increasing sample size and decrease with increasing frequency of out-of-tolerance measurements for an assumed tool certainty of 80%. A sample size of 22 measurements with only 1 failure indicates acceptance of the assumed tool specification (certainty 0.80) is justified at 95% confidence level (Fig. 2). Moreover, the sample size is large enough to help guard against false acceptance of the assumed specification.
API 1163 also describes how binomial distributions can be used to establish a criterion that the assumed tool performance can be clearly rejected at a given validation confidence level. The probability criterion sets a break point equal to 100% minus validation confidence level. If excessive out-of-tolerance measurements create a probability in a binomial distribution table below the break point, the assumed tool performance is rejected. For a validation confidence level of 95%, the break point is 5%. Five out-of-tolerance measurements in a sample size of 10 will cause rejection of the sample.
For binomial distributions, probability above the break point indicates the tool performance cannot be rejected, which, however, does not mean acceptance. Further evaluation or conducting more digs is necessary to ensure sample size is adequate, guard against false acceptance (Type II sample error), and determine the true certainty of the ILI system.
API 1163 points out that there are many ways of using confidence intervals to assess ILI system performance and that previous agreement between service-provider and operator may be required.
The preceding discussions used random samples. Practical considerations, however, typically prevent data used in analysis being random samples, drawing instead from a representative sample of locations and physical pipeline conditions. Since variations in corrosion along a pipeline can be significant, a sample of corrosion at one location may not mean corrosion along the entire pipeline. Regression-tree analysis or other statistical methods can categorize the corroded regions along the pipeline and be used to develop sampling plans.5
Evaluation of the ILI results, along with field-based sizing data should use POE to a target probability, irrespective of rejection or acceptance of an inspection vs. the purported specification. Identification of better-than-expected sizing performance could result in economic benefits by reducing the frequency of scheduled repairs.
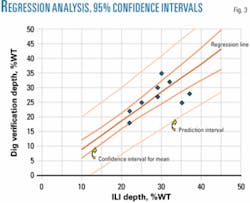
The application of descriptive statistics can determine the effects of better, or worse-, than-expected ILI tool-sizing performance. Linear regression attempts to explain this relationship with a straight-line fit to the data (depth reported by ILI and verified actual depth). Analyzing the variance of the data about the regression mean can determine confidence bounds (Fig. 3).
The sample regression equation is an estimate of the population regression equation. Like any other estimate, there is uncertainty associated with it. The uncertainty is expressed in confidence bands around the regression line. These bands share the same interpretation as the standard error of the mean, except that the uncertainty varies according to the location along the regression line. The uncertainty is least at the sample mean of the ILI depths and grows as the distance from the mean increases.
There are also bands predicting a single response at a particular value of ILI-reported depth. The standard error of the estimate for large samples functions as a standard deviation around the regression line. The demonstrated sizing tolerance from the available data is conservatively represented at the edge of the prediction interval (Fig. 3).
This representation illustrates the importance of a comprehensive sampling plan because validation of only the deepest defects may not accurately support sizing-performance data for comprehensive integrity evaluation. The incidence of data for actual sizing performance should at least equal that indicated by the sampling chart in Fig. 2.
Corrosion growth rate
External and internal corrosion growth rates in pipelines can vary depending on environment (coatings, soil conditions, and chemical species) and mitigative measures (coating condition, cathodic protection, and chemical inhibition). A number of tools and techniques can establish corrosion growth rates.
• Estimates from single inspection based on age (full-life or half-life) are not mechanistic or empirical and are the least desirable approach.
• Measurements from multiple inspection runs.
• Corrosion monitoring (direct measurements).
• Predictive models (soil resistivity models, species-specific models such as de Waard-Milliams).6
Mitigating measures or natural changes in local corrosion growth kinetics could achieve zero corrosion growth for any given metal-loss feature. It is also reasonable to expect, however, that the maximum possible growth rate is limited.
As previously described, regression-tree analysis can categorize the corroded regions along the pipeline and calculate the corrosion growth rates in these specific areas. The identification of the possible variance and distribution function for corrosion growth rates allows application of numerical simulation techniques and the calculation of POE. ✦
References
1. Pandey, M.D., “Probabilistic Models for Condition Assessment of Oil and Gas Pipelines,” NDT & E International, Vol. 31 (1998), No. 5, pp. 349-358.
2. Bhatia, A., Mangat, N.S., and Morrison, T., “Estimation of Measurement Errors,” International Pipeline Conference, Calgary, June 7-11, 1998.
3. Morrison, T., Mangat, N.S., Desjardins, G., and Bhatia, A., “Validation of An In-Line Inspection Metal Loss Tool,” International Pipeline Conference, Calgary, Oct. 1-5, 2000.
4. API 1163, “In-Line Inspection Systems Qualification Standard,” 2004.
5. Fenyvesi, L., Kania, R., Colquhoun, I., and Gu, B., “A Risk-Based Approach to Maintenance Planning Utilizing In-Line Inspection Data,” International Pipeline Conference, Calgary, Oct. 4-8, 2004.
6. EFCP No. 13, “Predicting CO2 Corrosion in the Oil and Gas Industry,” The Institute Of Materials, 1994.
