GULF SEVERE STORMS-2: Empirical models help gauge production lost due to storms
The Minerals Management Service collects shut-in production data from the survey response of operators following major storms, but the pre-Andrew record is sparse and, for early events, of variable quality.
To determine the impact of extreme weather on shut-in production in the absence of survey data, it is necessary to build models to infer what production would have been in the absence of the event.
In Part 2 of this two-part article, we develop two models to estimate shut-in production statistics in the Gulf of Mexico to gauge how weather events have affected oil and gas production. The results of the two models are generally consistent and indicate that shut-in production from the vast majority of weather events in the gulf is usually only a small percentage of annual production. Hurricanes Katrina and Rita appear as exceptional cases.
Seasonal impact model
Denote the official hurricane season (June 1 through Nov. 30) by H and the nonhurricane season (Dec. 1 through May 31) by N.
The actual hurricane season, Ha, varies with the appearance of the first reported tropical storm/hurricane and ends in the month of the last event of the season. The nonhurricane season, Na, is the complement of Ha.
Let Qi denote Gulf of Mexico hydrocarbon production for month i reported in barrels of oil equivalent. Hydrocarbon production over H, Ha, N, and Na is denoted Q(H), Q(Ha), etc. The number of weather events that occur in Ha is denoted n(Ha), and the number of months of Ha is denoted m(Ha). Average monthly hydrocarbon production per season is denoted as Q-(Ha) = Q(Ha)/m(Ha), etc.
Weather event ε is described by three factors: path, strength, and duration (speed). The physics and climatology of hurricane formation and motion are used by the National Hurricane Center to forecast the track and intensity of the storm, but after the event occurs, the storm parameters are known with a high degree of precision.
The path of the eye (center) of the storm is denoted by its time-varying latitude and longitude coordinates, Γε(t), which through the use of a binary variable, λε, is used to locate the storm path relative to its entry through the Western/Central and Eastern Gulf of Mexico: λε = 1, Γε(t) enters CGOM or WGOM; λε = 0, otherwise. If a storm enters the gulf at t0 and makes landfall at t1, then the duration of the event is δε = t1-t0. Storm strength is time varying with maximum strength described by the Saffir-Simpson scale and denoted by σε.
Weather events are aggregated across each hurricane season. The total duration of all the events that occur in the hurricane season is denoted: D(Ha) = ∙εϵHaδε. The strength of the event set is denoted, S(Ha) = ∙εϵHaσε, and the total number of entry paths into the WGOM and CGOM is computed as L(Ha) = ∙εϵHaλε (see box 1).
Model variants
Shut-in production is modeled as the difference between the total production over the nonhurricane and hurricane season, calculated in three ways, as follows:
(1): ∆1 = Q(N) - Q(H),
(2): ∆2 = m(Ha)[Q- (Na) - Q-(Ha)],
(3): ∆3 = Q(Nm) - Q(Ha).
In ∆1, the difference in the total production between the official hurricane and nonhurricane season is computed, while in ∆2, the average monthly production across the actual hurricane season is compared against the average monthly production in the nonhurricane season.
In ∆3, the difference in the total production between the actual hurricane season and the nonhurricane season, Nm, defined as equal in length to m = m(Ha) and immediately preceding the month of the first hurricane event, is computed.
Model ∆3 refines ∆2 since production is computed over the horizon closest to the hurricane season and normalized by its duration.
Model results
From 1950 to 2003, slightly more than three weather events impacted the Gulf of Mexico each year, lasting in duration anywhere between 2 to 6 weeks. The average strength of a weather event during this time registered 1.3.
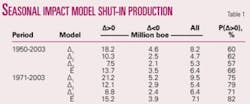
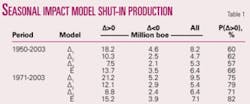
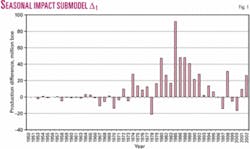
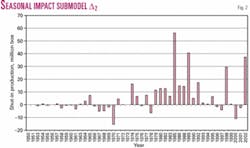
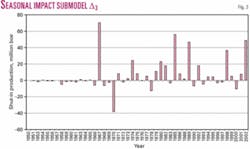
Shut-in production for each seasonal impact submodel is illustrated in Figs. 1-3 and reported in Table 1 in terms of magnitude and frequency of occurrence in 1950-2003 and 1971-2003. The results of an ensemble model, computed as the average of the three models, is also presented. From 1950 to 1970, shut-in production was centered around the origin, and only after 1970 did the magnitude and frequency of the impacts begin to increase.
null
null
null
From 1971 to 2003, the average shut-in production ranged from 5.4 to 9.5 million boe/season. Shut-in production can be either positive (Δ>0) or negative (Δ<0), and results vary with the time scale used in analysis and the specific submodel.
Shut-in production can be negative if seasonal growth rates exceed the impact of the storm. Shut-in production dominates gains on average by a factor of four.
For Model ∆1, 9.5 million boe production on average is shut-in across each hurricane season, and relative to pre-Katrina Gulf of Mexico production levels of 548 million bbl of oil and 3.65 tcf of gas (= 1,152 million boe), this amounts to less than 1% production capacity. There was a 75% chance 21.2 million boe would be shut-in and a 25% chance of a surplus of 5.2 million boe. For Ivan, cumulative shut-in production 5 months after the storm was 45 million bbl of oil and 173 bcf of gas (= 74 million boe). For Katrina and Rita, cumulative shut-in production 4 months after the storm was 190 million boe, or about 16% of annual gulf production.
In ∆2 and ∆3, the value of shut-in production is roughly half of the ∆1 statistic. In ∆1, the hurricane season is fixed in duration for each year of analysis, while in ∆2 and ∆3, the occurrence of extreme weather events is applied in the aggregation strategy.
The metrics associated with ∆2 and ∆3 are expected to be a more reliable predictor of shut-in production relative to ∆1. The three model results exhibit a reasonable degree of correlation: ρ(∆1,∆2) = 0.87, ρ(∆1,∆3) = 0.58, ρ(∆2,∆3) = 0.74.
Event impact model
In the seasonal impact model, weather events are aggregated across each hurricane season, and so the hurricane season represents the basic unit of analysis.
In event modeling, a month is used as the unit of analysis, and each month with a weather event is used to generate a data element.
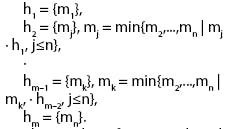
In hurricane season Ha, let {ε1,ε2,...,εn} denote the event set ordered in terms of occurrence in month (m1, m2,..., mn). If event ϵ falls entirely within month m, then ϵ is associated with m; otherwise, if the time interval of the event overlaps 2 months, the event is assigned to the month with the greatest overlap.
From the set (m1,m2,...,mn), weather events are aggregated, and each new month generates a data element as follows:
The number of events in hi is denoted by ni, and the duration, strength, and number of entry paths are defined analogous to the previous formulation; e.g., D(hi) = ∙εϵhiδε, S(hi) = ∙εϵhiσε, L(hi) = ∙εϵhiλε, i = 1,...,m (see box 2).
Model variants
Shut-in production is modeled as the difference between the production in the month of the event(s) and the model-predicted production, taken as the production in the prior month, the average of the preceding 2 months, and the average of the preceding 3 months.
For each month in the data set hi, i = 1,...,m, three shut-in production estimates are computed:
Model results
Event impact statistics reveal that slightly more than one weather event occurs each hurricane month, with an average duration of 9.5 days and an aggregate 2.0 category strength.
null
null
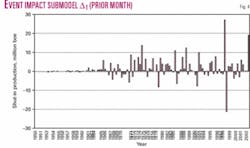
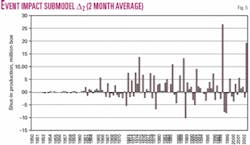
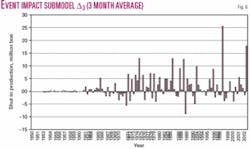
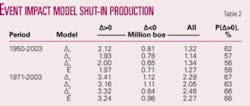
The standard deviations of the reported statistics are on the order-of-the mean indicating wide variation in the results. Shut-in production statistics for each of the three submodels are illustrated in Figs. 4-6 and summarized in Table 2.
From 1971 to 2003, average shut-in production ranged from 2.1 to 2.5 million boe/month, which is broadly consistent with the results from the seasonal impact model. The ratio of shut-in production to production gains is roughly three across each of the models considered, and the probability of production being shut-in is also consistent with the previous model.
Event impact model correlations are significantly stronger than in the seasonal model due in large part to the model formulation and the manner in which production loss was estimated:
ρ(∆1*,∆2*) = 0.90, ρ(∆1*,∆3*) = 0.97, ρ(∆2*,∆3*) = 0.88.
Model specification
Shut-in production is expected to vary in proportion to the magnitude of the event, the path and duration of the storm, and the number of storms that occur within the hurricane season. The correspondence is expected to be noisy and weak due to the presence of multiple confounding factors that cannot be isolated.
Regression models are constructed for each model class according to the following relation:
Δ = α0 + α1L + α2S + α3D+ α4n + α5t,
where L denotes the total number of storm paths that enter regions of high-density infrastructure, S indicates the maximum strength of the event, D the total duration, n the number of events, and t the year of the event. Shut-in production is expected to be positively correlated with L, S, D, and n.
Storms that enter regions with a high concentration of infrastructure are more likely to impact facilities and require damage assessment and repair, delaying start-up activities, while high category storms are more likely to incur physical damage and to permanently impair production activity. Slow moving storms take out production for a longer period of time and prevent operational activities from returning to normal in a timely manner, and storms which form after a hurricane typically delay inspection and repair operations.
The quality and use of weather information to determine shutdown and evacuation decisions, and the occurrence of the event over the horizon of the analysis, may also play a role in the storm’s impact. The use of the time variable serves as a gross proxy to capture the dynamics of improved forecasting and-or improvements in design standards.
Model results
The nature of oil and gas production in the Gulf of Mexico and characteristics of the modeling process result in both shut-in production and production gains.
The record is truncated by restricting the time horizon to 1971-2003, and production gains are removed from analysis. The descriptive variables are computed at the level of aggregation specified for the seasonal and event impact model.
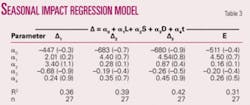
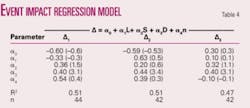
Model results are summarized in Tables 3 and 4. The coefficients are generally not significant, but they are mostly of the right sign, and the fits appear “reasonable” considering the nature of the data and the model uncertainty. The event impact regressions are the more robust model class with duration a significant descriptor (see box 3).
null
Conclusions
The threat of hurricanes poses a growing risk to Gulf of Mexico production as deepwater structures produce the majority of hydrocarbons in the region.
Since a greater amount of gulf production is being produced from a smaller number of structures, GOM production is increasingly susceptible to volatility due to extreme weather events.
Since Hurricane Andrew, the MMS has collected shut-in production data from the survey response of operators following most major storms, but the pre-Andrew historical record is sparse and, for early events, of variable quality. To determine the impact of extreme weather on shut-in production in the absence of survey data, it is necessary to build models to infer what production would have been without the occurrence of the event.
Because of the uncertainty involved in the inference, model classes were constructed based on the application of two time scales-the hurricane season and monthly production. Each model has its advantages and disadvantages and is subject to its own set of assumptions.
The results of the two models were generally consistent and indicated that shut-in production from the vast majority of weather events in the gulf is usually a small percentage of annual production. Hurricanes Katrina and Rita appear as exceptional cases.
The study examined the historical production data in the gulf and constructed models to estimate the impact of extreme weather on shut-in production statistics.
It is possible to improve upon the model structure by delineating the storm path more precisely, or in terms of water depth categories, but production would also have to be decomposed according to similar planning area and water depth decomposition. The value of this exercise is questionable.
A more useful generalization would examine oil and gas production streams separately, rather than an aggregate (boe) stream, and consider a formal econometric approach to examine the impact of seasonal patterns in production. Some of the model descriptors could also be revised, replacing the maximum storm strength, for example, by an average strength across the track of the hurricane.
Hurricanes are a complex and dynamic physical process, and their decomposition to one-dimensional output variables will certainly introduce bias in any model development. ✦
References
1. National Weather Center.
2. Blake, E.S., Rappaport, E.N., Jarrell, J.D., and Landsea, C.W. , “The deadliest, costliest, and most intense United States tropical cyclones from 1851 to 2004,” Tropical Prediction Center, National Hurricane Center, Miami, Fla., August 2005.
3. National Oceanic and Atmospheric Administration, 2003.
4. Rach, N., “Gulf of Mexico rig market responds to hurricanes,” OGJ, Nov. 21, 2005.
5. Abraham, K.S., “Battering of US GOM structures brings discussion of standards,” World Oil, Vol. 226, No. 11, November 2005, pp. 51-60.
6. Snow, N., “Industry, government address MODU reliability issues,” OGJ, Dec. 19, 2005.
7. Office of Electricity Delivery and Energy Reliability, US Department of Energy, Gulf Coast Hurricane Situation Report #45, Dec. 15, 2005.
8. Energy Information Administration, “Hurricane Katrina’s impact on the US oil and natural gas market,” Daily Reports, 2005.
9. Lessons from the Hurricanes, Petroleum Industry Research Foundation Inc., November 2005.
Seasonal impact model parameters (Box 1)
In 1998, six storms passed through the Gulf of Mexico: Charley (8/21-8/24), Earl (8/31-9/8), Francis (9/8-9/13), Georges (8/15-9/1), Hermine (8/17-8/20), and Mitch (9/22-10/9). The duration vector (δε1,...,δε6) = (4, 9, 6, 16, 4, 17), strength vector (σε1,...,σε6) = (0, 2, 0, 4, 0, 5), and path vector (λε1,...,λε6) = (1,1,1,1,1,1) are determined from historical statistics and storm paths available from the National Hurricane Center. The actual hurricane season is described by Ha = {August, September, October} and D(Ha) = 56, S(Ha) = 11, and L(Ha) = 6.
Event impact model parameters (Box 2)
The 1998 hurricane season event set is described by h1 = {August}, h2 = {September}, and h3 = {October}. The associated data elements are computed as (n(h1), n(h2), n(h3)) = (1, 4, 1), (D(h1), D(h2), D(h3)) = (4, 35, 17), (S(h1), S(h2), S(h3)) = (0, 6, 5), and (L(h1), L(h2), L(h3)) = (1, 4, 1).
Example of model calculation (Box 3)
If two category-3 hurricanes pass through the Central Gulf region in 1 month and have duration of 8 and 10 days, the expected impact on GOM shut-in production is estimated to range between
∆1* = -0.60 -0.33(2) + 0.36(6) + 0.40(18) + 0.54(2) = 9.2 million boe and ∆2* = 10.6 million boe.
