GULF SEVERE STORMS-1: Analysis of extreme weather events shows vulnerability of Gulf of Mexico production
Mark J. Kaiser, Allan G. Pulsipher: Louisiana State University, Baton Rouge
Extensive damage to oil and gas facilities and pipelines has brought to light the vulnerability of offshore production in the Gulf of Mexico the past 2 years. The 2005 season produced three major storms-Katrina, Rita, and Wilma-and 27 named storms and resulted in more than 1,700 deaths in the US, with the majority of those attributed to Katrina and the widespread destruction of New Orleans through the Mississippi Gulf Coast.
The purpose of this two-part article is to examine the impact of extreme weather on oil and gas production in the GOM and to develop first-order models of shut-in production statistics.
Hurricane events
Storms and hurricanes regularly challenge and endanger the coastal community and energy infrastructure throughout the gulf.
Powered by heat from the sea, tropical cyclones are steered by the easterly trade winds and the temperate westerlies, and around their core winds grow with great velocity and generate ferocious and violent seas. Each year around 100 tropical disturbances develop between May and November over the Atlantic Ocean. About 25 of these disturbances develop into tropical depressions, of which on average 10 become tropical storms, 5 become hurricanes, and 2-3 are likely to strike the US coast. Storms that grow into 75 mph sustained winds are classified as hurricanes.
Hurricanes are characterized by pressure, wind speed, and storm surge, but since there is not a one-to-one relationship between these elements, maximum wind speed is used to establish the Saffir-Simpson category: Tropical storms correspond to 39-73 mph winds, a category-1 storm corresponds to 74-95 mph winds, category-2 storm corresponds to 96-110 mph winds, category-3 storm corresponds to 111-130 mph winds, category-4 storm corresponds to 131-155 mph winds, and category-5 storm corresponds to greater than 155 mph winds (Table 1).
null
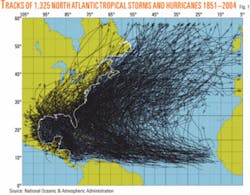
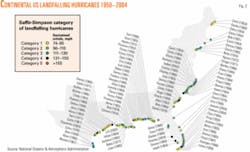
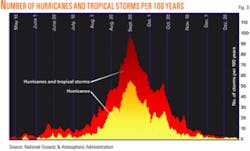
Tropical storms traverse all parts of the gulf, and nowhere is immune from a hit (Figs. 1 and 2). The official hurricane season in the Atlantic basin begins June 1 and ends Nov. 30, and historically, the most active time for hurricane development is mid-August through mid-October (Fig. 3).
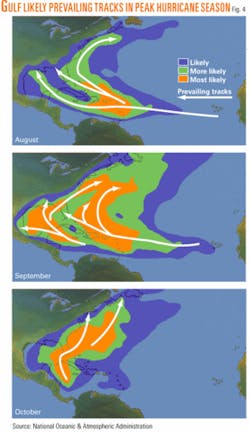
August through October contains 78% of the tropical storm days, 87% of the minor (categories 1 and 2) hurricanes, and 96% of the major (categories 3, 4, and 5) hurricane days.1 The threat of major hurricanes increases from west to east during the season with major hurricanes favoring the US East Coast by late September.2 The likely prevailing tracks for hurricanes are seasonally dependent (Fig. 4).
null
Operator response
When a hurricane enters the Gulf of Mexico, oil production and pipeline facilities in the expected path of the storm are shut down, crews are evacuated, and refineries and processing plants along the Gulf Coast close.
Drilling rigs pull pipe and anchor down, while supply vessels, commercial ships, and barges may be moved into a bayou for more protection. Ocean-going vessels transiting the gulf near the time of the event use hurricane forecasts to plot course to avoid the storm. River and coastal ports close, and the Louisiana Offshore Oil Port (LOOP), the country’s only deepwater oil port, shuts down until the storm passes.
Immediately after the storm makes landfall, operators and service providers regroup, and most of the 25,000 or so personnel involved in the offshore industry return to work. Crews are transported back to production facilities, damage assessments are performed, and facilities are repaired prior to the resumption of production.
Drilling rigs that broke loose from moorings are relocated, remanned, and repowered. Drilling rigs that are damaged are moved to shipyards for inspection, repair, or salvage. Platforms and pipelines are repaired on site. Offshore supply vessels, diving, and transportation companies are normally in high demand during the weeks following a storm to perform inspection and repair work.
Storm impacts
Tropical storms damage physical, economic, biological, and social systems.
In the US, average annual damage from hurricanes and floods has been estimated at $10.3 billion, with floods accounting for $5.2 billion and over 80 deaths/year and hurricanes averaging $5.1 billion and 20 deaths/year.3
In the offshore energy industry, research is primarily concerned with the design standards and risk assessment to withstand the so-called “100-year storm”-the worst wind, wave, and current conditions expected in any arbitrarily chosen 100-year period.4
In extreme weather, damage to offshore facilities is unavoidable and can take many forms: platforms and caissons can list, topple, or be severely damaged; rigs may be torn from their moorings and set adrift; barges and workboats are frequently grounded or capsize; flowlines, pipelines, and subsea equipment can be damaged and dislocated by a dragged anchor or mudslide, leading to an oil or gas leak; structural supports may be bent or dislocated; topsides equipment such as pumps, production vessels, tank batteries, and power generators may be destroyed or require major repair; cranes, helicopter landing decks, living quarters, rigs, and other equipment may be shifted, overturned, collapsed, or destroyed.
Design standards
Operators design their structures for high survivability, but in extreme weather, some damage is unavoidable.
Each hurricane is unique, and the response of structures, pipelines, and drilling rigs in the path of the storm is also unique.
Design criteria for offshore structures are specified by American Petroleum Institute RP 2A guidelines (API RP2A 2000) and have evolved over many years to ensure survivability.5 6
Regulatory agencies will generally accept the risk of losing a structure where there is no threat to life or the environment. The owner may be willing to accept the risk on less important structures (such as caissons and well protectors), but monetary considerations usually dictate increased capacity for structures with a high production rate, facilities which serve as a transportation or processing hub, and deepwater structures.
A tradeoff thus exists which attempts to balance the potential costs of damage and disruption due to a catastrophic weather event against the benefits of a more robust (but expensive) design.
Production profiles
Operators report shut-in production statistics on a daily basis when hurricanes enter the gulf and in the weeks and months after the event.
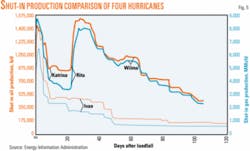
After Hurricane Ivan in late September 2004, damage to subsea pipelines, production platforms, and onshore processing facilities required six weeks to restore 80% of shut-in production and 10 weeks to restore 90% of shut-in production (Fig. 5). Cumulative shut-in oil and gas production for Ivan was 45 million bbl and 173 bcf.
The paths of Hurricanes Katrina and Rita crossed high-density infrastructure regions and caused extensive damage to the natural gas systems and processing facilities (Fig. 6). About 28% of daily oil output and 23% of daily gas output was shut-in 4 months after the event, with cumulative shut-in oil and gas production of 102 million bbl and 526 bcf.7
Many factors impact the shape of the shut-in production curves. The Minerals Management Service requires operators to shut down facilities and evacuate personnel with the approach of extreme weather, and thus the storm path, speed, strength, and operator response will all affect the rate at which production is shut in and the peak value of the curve.
The duration of the storm and its impact on production platforms, pipeline infrastructure, and onshore facilities will determine the plateau and slope of the profile after the peak. Many factors may complicate and delay efforts to get production back to pre-storm levels, including damage to staging areas and the plants that supply power to these facilities, the availability of service vessels and helicopters, and the effects of personnel dislocation and property loss. If onshore gas processing plants are inoperable for any length of time, as occurred with Katrina and Rita, the loss could delay a recovery of natural gas production-even if platforms and pipelines are unaffected-because gas usually needs to be processed before flowing to market.
Market response
In the Gulf Coast, oil, natural gas, and refined product prices rise in anticipation of supply disruptions that threaten the region.8 9
Price spikes due to hurricanes or an oil spill at the mouth of the Mississippi River are signs of a well-functioning market, and after the extent of damages and disruption becomes better understood, spot and futures prices adjust according to market perception and spare capacity and inventory levels.
Following Katrina and Rita, the markets for crude oil and petroleum products, combined with successful government intervention (including crude oil release from the Strategic Petroleum Reserve, relaxing sulfur requirements on gasoline and diesel production, and increased crude and gasoline imports) acted to dampen price surges of these commodities relatively quickly and efficiently.9
Conditions for natural gas did not respond in the same way, however, since there is neither strategic reserve to draw upon nor cost effective purchase agreements for import. Spot and forward prices for natural gas and electric power reached record-highs in the aftermath of the disaster.
Emergency plans
The occurrence of extreme weather requires operators to decide what facilities to shut down and when personnel should be evacuated.
Current operating philosophy requires the evacuation of all personnel before the latest safe departure time and the shutdown of production and drilling activity. Shutting down production has an immediate negative economic impact on the operator, but because of the risk to safety and the environment, a “conservative” approach is normally taken in planning activity.
Companies develop emergency procedures for the operation, evacuation, and securing of each rig or platform in adverse weather. A well-defined sequence of activities is followed:
1. Regional tropical cyclone climatology is reviewed for area of operation;
2. National Hurricane Center (NHC) analysis/forecast charts are obtained, including surface, upper level, and sea state (wind/wave) charts;
3. Tropical waves, disturbances, and tropical cyclones are located and plotted;
4. The closest point of approach and time to the tropical cyclone is calculated;
5. Decisions on the course of action to follow on the latest safe departure time are made and executed; and
6. Actions are reviewed when new meteorological analysis and forecast information becomes available.
At 5-7 days before the expected arrival of the hurricane, the evacuation and shutdown action plan is initiated. Storm path, speed, and intensity as forecast by the NHC is typically supplemented by in-house/consulting meteorologist and/or local weather service providers.
Team leaders, operational managers, and meteorologist usually meet twice daily to plan and schedule evacuation activities with primary consideration given to the latest safe departure time for personnel. Shutdown and evacuation schedules will vary with each operator because of the diverse geographic distribution of infrastructure and the different levels of risk tolerance and expectations of the storm path.
Operators are responsible for the safety of all personnel on their structures, and 2-5 days prior to the arrival of the storm all nonessential personnel are evacuated during daylight hours. Essential personnel are the last to go and are transported to shore after wells are closed and topside equipment secured 1-2 days before the storm is expected to hit. Well shutdown can be performed automatically, in fact nearly instantaneously, where automatic control systems are deployed; for platforms, shutdown is performed in stages according to facility requirements.
Shortly after the passage of the storm, offshore personnel return to work and inspect pipes, pumps, and process facilities. Depending on the severity of the storm and damage reports, the MMS will issue a Notice to Lessees requiring operators to conduct a Level X (X = I, II, III) survey for all infrastructure that falls within a Y-mile corridor around the storm path.
The values of X and Y are determined by the MMS and depend on the severity of the storm and damage reports provided by operators. The complexity of the inspection increases with the level specified, ranging from a Level I visual inspection from the topside to a Level III diver survey. The strictest inspection requirements occur closest to the eye of the storm path and the region of the most damage.
Starting up production and repressurizing wells after shutdown usually takes a few days, especially when underwater inspections need to be performed. Engineers bring up pressure on pipelines gradually in order to minimize environmental damage if leaks are discovered. Pipelines that leak are isolated and production behind the pipe is shut-in until the problem is fixed.
The US Coast Guard may supervise clean-up operations. Wells that have been shut in can suffer from temporary shifts in the reservoir pressure, reducing initial output for weeks or months, while in other fields, shutting down a well can help rebuild pressure and enhance production rates.
The success of start-up operations depend on the damage caused by the storm, the characteristics of the geologic formation, and the complexity of the wellbores. Since most Gulf of Mexico crude oil is light and in primary production, start up activities are mostly performed without consequence, and assuming minimal storm damage, platforms may come back on-line within 48-72 hr of evacuation.
For shut-in wells, water may invade producing zones that will take time to reduce. Floating production systems, which operate in the deep waters of the gulf where hydrates may form, may take up to one week to resume production. Most deepwater developments use insulation to preserve production thermal energy, which is critical during emergency shut-ins.
Statistical analysis
Extreme weather events typically occur over a few days, and their immediate, direct impact will last anywhere from 1-2 weeks to several months after the event.
Production data in the gulf are only available on a monthly basis, however, and although the MMS requires operators to report shut-in production on a daily basis when a hurricane enters the gulf, reliable historical statistics for shut-in production are only available for a small set of events over the past decade-mostly major (Category 3 and above) hurricanes occurring after Andrew. The mismatch between the time scales and lack of survey data for early events means that a model for shut-in production will need to be constructed.
Weather events are treated as independent, but their impacts, especially if they occur in spatial or temporal proximity to one another, will be correlated to some extent. Weather events are thus aggregated on a monthly basis, and since more than one event may occur in 1 month, an event may occur over 2 months, or multiple events may occur over several months, confounding effects can be expected.
Hydrocarbon production is an extractive operation and in the offshore environment is subject to many sources of uncertainty, including changes in reservoir behavior, drilling schedules, investment decisions, maintenance requirements and workovers, capacity expansions, production problems, and extreme weather events.
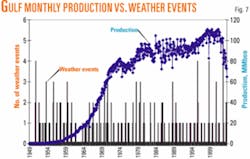
Weather is one factor among many that impact production volatility. Changes in production frequently coincide with the occurrence of extreme weather but the correspondence is noisy (Fig. 7), and because Gulf of Mexico production has been in a general growth trend throughout the period, the overall impact of weather events on production volatility has been dampened.
Hydrocarbons are extracted from one or more zones in a well, and production from one or more wells, on one or more leases, is sent to a structure for processing before being transported to shore. We first compare average production over the official hurricane season (June 1-Nov. 30) from 1950-2003 to the average production over the nonhurricane season (Dec. 1-May 31).
If weather was a significant cause of shut-in production, we would expect the average production over the hurricane season to be significantly smaller relative to the nonhurricane season, but this was not observed. Production over the hurricane season is only slightly smaller in magnitude, 58.2 million boe/month on average compared with 59.7 million boe/month, or a seasonal difference of roughly 9 million boe.
Annual production cycles are correlated against “above normal,” “near normal,” and “below normal” hurricane seasons defined through NOAA’s Accumulated Cyclone Energy (ACE) Index (Fig. 8).
ACE measures collective intensity and duration of tropical storms and hurricanes occurring during a given season, and is defined as the sum of squares of the estimated 6-hourly maximum sustained wind speed for all named systems while they are at storm strength. The 1951-2000 mean value of the ACE index is 93.2.
An ACE index above 103 defines an above normal hurricane season, 66Production has grown over the past half-century, and so the relative magnitude of the profiles is not relevant since production from various years are aggregated according to the ACE Index.
The interseasonal component is the key factor. Above normal hurricane seasons had a difference of 8.9 million boe between the hurricane and nonhurricane months, which decreased to 6.5 million boe for near normal seasons, and 4.8 million boe for below normal seasons.
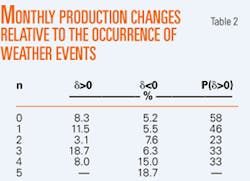
Month-to-month variations over the non-hurricane season dominate the production variability over the hurricane season, but a more revealing statistic examines the month-to-month production change, δ, as a function of the number of weather events, n.
For months with no weather event, the average monthly production change was a positive 8.3% representing growth in production. As the number of weather events per month increases, the average monthly production change becomes increasingly negative and on a more frequent basis (Table 2).
Next: Statistical models infer degree of lost production from extreme weather events. ✦


