Cheryl J. Trench
Allegro Energy Consulting
New York
Mark D. Weesner
ExxonMobil Pipeline Co.
Houston
Since the voluntary environmental performance tracking initiative Pipeline Performance Tracking System began in 1999, the petroleum pipeline industry has reduced both the number and volume of crude, refined product, and highly volatilile liquid (HVL) spills. Improved testing and repair techniques, improved integrity-management practices, and an increased emphasis on managing pipeline risk have led to these reductions.
PPTS records detailed information about spills and releases, their causes and consequences. The pipeline members of the American Petroleum Institute and the Association of Oil Pipe Lines believe that tracking and learning from spills will further improve performance and demonstrate their commitment to improving safety and environmental protection by the analysis of results.
This article reviews the industry’s record since PPTS was introduced and highlights insights that come from PPTS.
Pipeline operators participating in PPTS voluntarily report spills of 5 gal or more to land, all spills to water, and any incident deemed reportable to the US Department of Transportation. In 2004, pipeline operators participating in PPTS accounted for about 85% of the total interstate oil pipeline mileage and volume throughput.
Operators enter their release records electronically into a system maintained on API’s server. Data verification efforts are extensive. These include an incident-by-incident comparison to releases reported with the DOT’s Pipeline and Hazardous Materials Safety Administration, checking for completeness and accuracy.
While specific incident information recorded in PPTS remains confidential, aggregate data from all of the reported spills are compiled for the data mining team (DMT), the industry committee that manages PPTS and analyzes the data. The DMT publishes results of the analyses in advisories that the pipeline industry can use to better manage pipeline risk.
The team prepared this article and its graphs. The article discusses the results for 2004 first then summarizes trends from the first 6 years of PPTS data, 1999-2004.
2004 highlights
Spills from facilities piping showed their first significant decline since PPTS tracking began. Facilities piping includes operator-controlled pump stations, metering sites, and tank farms. The decline may represent the increased emphasis by pipeline operators on managing integrity and risk within these facilities, as opposed to managing the same factors in the right-of-way, where previous efforts had concentrated.
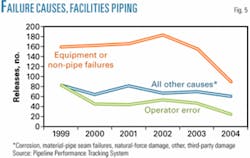
Spills caused by equipment failures (nonpipe components such as valves, fittings, and pumps) and operator error both showed their first significant declines in 2004, a natural corollary to the improved performance inside the facility fence, where most of these releases occur. The increased emphasis on facilities integrity and risk management contributed to this decline.
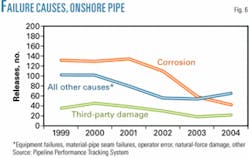
Corrosion spills continued to decline, led by the reduction in spills from crude oil systems. This decline demonstrates the effectiveness of in-line inspection tools in identifying potential corrosion locations on pipelines so they can be repaired before failure. Corrosion continues as the leading cause of onshore pipeline spills.
Other causes of spills by onshore pipeline systems (other than corrosion) increased slightly in 2004, resulting in a relatively flat year-to-year performance for onshore pipelines after 3 years of significant declines. While work continues on reducing corrosion-related spills, onshore pipeline spills involving other causes (most notably third-party damage and equipment failures) also represent areas where further analysis and improved processes should be able to improve performance.
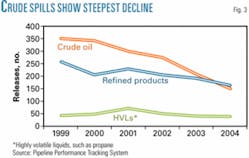
After years of steady decline for spills from both crude oil systems and refined product systems, the number of releases for the two types of systems was about equal for the first time in 2004. Crude oil spills were about one-third more numerous than refined product spills but declined rapidly due to improvements in corrosion-spill prevention in onshore pipelines.
Unlike small spills that continued to decline in 2004, the number of releases of 50 bbl or more remained unchanged. This development prompted the industry to begin a more thorough examination of causes to determine how improvements can be made in this area.
Volumes spilled in 2004 remained about the same as 2003, due at least in part to 15,000 bbl released as a result of Hurricane Ivan.
The volume released due to causes other than natural-force damage continued to fall.
PPTS 1999-2004
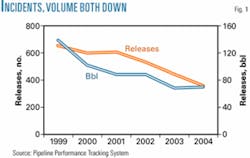
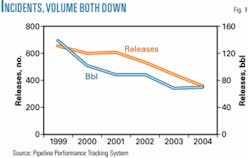
Since 1999, PPTS-reported incidents fell 46%, and volume fell 50%. Participants reported 657 incidents to PPTS in 1999 and 358 in 2004 (Fig. 1). The number of incidents declined each year since 1999. Barrels released, while falling roughly 50%, to 70,000 bbl in 2004 from 138,000 bbl in 1999, show a more uneven year-to-year pattern. Between 2003 and 2004, for instance, the volumes released rose very slightly, due at least in part to releases related to Hurricane Ivan.
The data for 2005 will also show a significant spill volume related to hurricanes Katrina and Rita, which affected onshore and offshore oil pipelines and associated shore-based facilities in the Gulf Coast.
• The number of small spills declined more rapidly than the number of large spills.
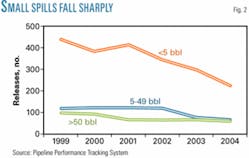
Spills of fewer than 5 bbl account for about two thirds of the total number of incidents reported between 1999 and 2004 (Fig. 2). These spills fell by roughly 50%,to 223 in 2004 from 441 in 1999 .
Spills of 5 bbl or more fell by 37%, to 135 from 216. The reduction in the more numerous small spills helped drive the overall improved record with respect to frequency of releases.
• Spills of 50 bbl or more number about 70 each year since 2001.
Spills of 50 bbl or more account for 14% of the total number of releases but 98% of the volume released. As such, it is not surprising that they affect the environment and safety more and that more of them affect private property through damage, inconvenience, or demands on the local infrastructure.
The lack of progress in preventing larger spills hinders the industry in reducing the negative effects on the surrounding community.
• Crude oil systems experienced the most releases, but performance improved markedly.
More than half of all releases occurred on crude oil systems, but their incidence fell to 153 in 2004 from 352 in 1999, a 57% decline (Fig. 3). Releases from refined product systems went to 164 from 261, a 37% decline. Crude began the period with about 35%/year more incidents than refined product and ended the period at about the same number of annual incidents.
Corrosion causes more crude oil releases than any other factor. In-line inspection efforts that focus on corrosion detection improve crude pipeline performance and reduce the number of spills occurring on onshore pipe.
Refined product releases, in contrast, more commonly occur in facilities piping, and continued inspection improvements in facilities will reduce them.
Incidents involving highly volatile liquids (HVL) such as propane are relatively few but tend to result in high-volume releases. More than 20% of these infrequent releases are 50 bbl or larger. Third-party damage, at a 41% share, causes the bulk of these large HVL releases.
• Most large spills occur along onshore pipe. Facilities spills are more numerous.
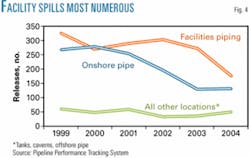
Releases from facilities piping account for more than half of the incidents but only about one-quarter of spills of 50 bbl or more (Fig. 4). Onshore pipe, by contrast, accounts for about 32% of all spills, and 63% of those are of 50 bbl or more. While spills on operator-controlled property are therefore more frequent, prudent risk management gives a priority to addressing releases on the pipeline right-of-way, where the public may be inconvenienced, or even put at risk.
The industry’s rapid improvement in the onshore spill record reflects this risk ranking.
• Most frequent incident causes: equipment failure in facilities piping, corrosion in onshore pipe.
Failures of equipment and non-pipe components account for the greatest share of incidents, 37%. A critical factor for risk assessments, however, is that almost 80% of equipment, non-pipe failures occur in facilities piping, away from the right-of-way and the public (Fig. 5). By contrast, 70% of corrosion releases occur along the right-of-way, where they are the leading cause of onshore pipe releases (48%; Fig. 6).
• Third-party damage is the greatest cause of large spills on the right-of-way and of injuries.
Current or previous third-party damage releases account for less than 7% of total incidents, but nearly 90% of these releases occur along onshore pipe right-of-way, putting those not associated with the pipeline at risk. Not only does third-party damage account for a greater share of onshore pipe spills (15%) than of all spills, it is also the greatest cause of incidents involving death and injury.
Recognizing that generally different causes lead to large spills and small spills also plays a critical role in risk management. Third-party damage is the largest cause of large spills, accounting for 25% of all releases of more than 50 bbl. It accounts for an even larger share (almost 40%) of spills of 50 bbl or more along the right-of-way. Equipment failures, by contrast, account for 37% of all releases, but a smaller share (16%) of releases of 50 bbl or more and a larger share (45%) of releases of 5 bbl or less. Since these equipment-related releases largely occur and remain contained in facilities, not along the right-of-way, they are not typically a threat to surrounding people or property
Third-party damage, either current or past, contributed to four of the five fatality incidents from 1999-2004, causing 10 of the 11 fatalities during this period. Third-party damage led to 50% (8 of 16) of the incidents that involved an injury (a total of 15 injuries). All of the fatalities and all of the injuries due to third-party damage were members of the public or workers who were neither employees nor were pipeline contractors.
Operator error caused the next highest number of incidents involving injury. The 10 people injured in five incidents were all pipeline employees or contractors.
Corrosion incidents did not result in any fatalities or injuries from 1999 to 2004.
Not only excavators
PPTS provided an opportunity, for the first time, to examine data on what kinds of enterprises were involved in mechanical-force damage incidents leading to pipeline failures. Most involved farming activities, not traditional excavations. This information alone targets farming areas for public outreach from pipelines seeking to prevent third-party damage.
The entities most actively aware of “Call Before You Dig” or one-call systems also frequently caused incidents. Utilities accounted for 18% and pipelines for 11% of all incidents. Combined, those who pay for the system and must respond to requests for facility identification, account for a larger share of incidents than farming activities. This information again provides a roadmap for addressing damage prevention.
Operator error
The DMT classifies mechanical-force damage incidents involving the operator as operator error but identifies them separately. These incidents also occurred more frequently than had formerly been understood.
Adding incidents caused by operators and their excavators to those involving utilities and other pipelines brings the total caused by parties who “should know better” to 43%.
These findings helped shape industry activities and publications to better address mechanical-force damage.
Operator error (other than excavation or mechanical-force damage) generally causes relatively small spills but has been involved in injuries to employees and contractors. It also causes the second largest number of facilities piping incidents.
Regulators also pay close attention to operator error, with operator qualification (OQ) provisions fully implemented in 2002.
PPTS data show that from 1999-2004 incidents caused by operator error (including operator excavation) fell by 70% for those involving facilities piping, and by 65% for those occurring on onshore pipe.
Other causes
Corrosion, equipment failures, third-party damage, and operator error account for 83% of all incidents reported to PPTS. Although not discussed in detail in this article, the industry also pays attention to the rest of the causes captured by PPTS: material and pipe seam failures, natural-force damage, miscellaneous tank failures, and others. Accounting for a combined 17% of incidents, these types of failures are relatively infrequent.
Material and pipe seam failures occurring on all parts of the system, for instance, fell by more than 50% 1999-2004. Those occurring on onshore pipelines fell by two-thirds, to only 11 industry wide in 2004.
Acknowledgments
The authors acknowledge the contributions of their colleagues on the Data Mining Team. Other current members are: Hazem Arafa, API; Kevin J. Badgett, ExxonMobil Pipeline Co.; Frank Gonzales, Buckeye Partners LP; Michele Joy, Association of Oil Pipe Lines; Tom Kelly, Colonial Pipeline Co.; David Knoelke, BP Pipelines (North America); Ed Landgraf, Shell Pipeline Co.; Peter Lidiak, API; Tom Price, ConocoPhillips Pipe Line; Marc Wolgamott, Koch Pipeline Co. ✦
The authors
Cheryl J. Trench ([email protected]) has been president of Allegro Energy Consulting since 1997. She spent the previous 22 years at Petroleum Industry Research Foundation Inc., leaving as executive vice-president. Trench received a BA in economics from City University of New York. She is a member and past chapter president of the International Association for Energy Economics and president of The Energy Forum Inc.
Mark D. Weesner is reliability and maintenance-improvement program manager at ExxonMobil Pipeline Co. Past positions include risk and integrity advisor, ExxonMobil Pipeline Co., and global supply advisor for ExxonMobil Lubricants & Specialties Co. Weesner received a BS (1980) in mechanical engineering from Texas A&M University and is a registered professional engineer in Texas. He is also a member of the American Society of Mechanical Engineers.
