CO2 flooding revitalizes old giant field
Through a fully integrated team approach to reservoir management, Occidental Permian Ltd. has proved that CO2 flooding in the North Hobbs Unit is a viable economic process even in a highly heterogeneous reservoir that requires constant surveillance and monitoring.
Oxy indicates a key challenge in operations has been the control of the GOR while maintaining oil production rates.
Abel Salazar, Sharon Haggard, Vishnu Simlote, Hobbs reservoir engineers for Oxy Permian, and Randy Stilwell, Hobbs geologist for Oxy Permian, described the project for OGJ.
North Hobbs Unit
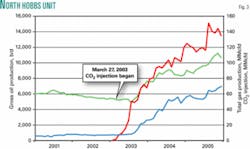
Occidental Permian Ltd. initiated CO2 injection in the North Hobbs Unit, Lea County, NM, on Mar. 27, 2003. The unit occupies the northern half of the Hobbs field, an anticlinal structure about 8 miles long and 4 miles wide, at the northwest end of the Central basin platform of the Permian basin. The field is about 90 miles northwest of Midland, Tex.
Since CO2 injection started, oil production from the unit has doubled to more than 11,000 from 5,000 bo/d previously. The unit produces primarily from San Andres shallow-water dolomites, although the maximum 500-ft hydrocarbon column includes a small gas cap extending into the overlying Grayburg siltstones.
At Hobbs, the San Andres reservoir is very heterogeneous and exhibits a strong karst overprint, especially in the upper zones. Producing porosities range from 9 to more than 30% with permeabilities generally in the 1-300 md range. Some isolated permeabilities greater than 1 Darcy are observed.
The current CO2 flood targets the middle and lower San Andres, avoiding the more karsted horizons near the top.
The highly variable nature of the reservoir and the karsted intervals present significant challenges to injectant conformance control in this field.
Development history
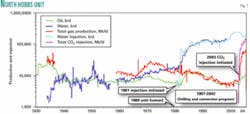
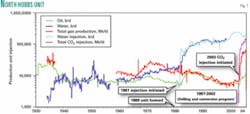
The field was discovered in 1928. In 1980, the North Hobbs Unit was formed with water injection starting in 1981.
From the peak waterflood response in the late 1980s through 1996, North Hobbs oil production was on an established decline. Improved surveillance, reservoir management, increased water injection, and limited drilling and conversion programs flattened the oil production decline from 1997 through 1999 (Fig. 1).
In 1999, following a detailed reservoir characterization study, a simulation model identified opportunities for improving the Hobbs waterflood. Combined with a major expansion of the water injection system, Oxy implemented a more extensive drilling and conversion program to standardize pattern geometry in 2000-01. This reversed the oil decline and increased production by about 1,500 bo/d.
When the waterflood returned to the established decline and matured (2.8% oil cut), Oxy decided to initiate a 20-pattern CO2 flood that was analogous to other floods in the Permian basin. The amount of residual oil left after waterflooding is a substantial target at North Hobbs, which had about 750 million bbl of original oil-in-place.
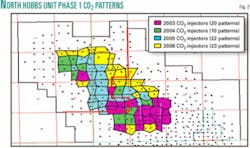
CO2 injection started in March 2003 with 20 patterns (Phase 1A). This was followed by 10 patterns (Phase 1B) in the 4th quarter of 2004, and 22 patterns (Phase 1C) in 2005. Based on the successful results, Oxy is adding an additional 23 patterns (Phase 1D) in 2006-07 (Fig. 2).
CO2 flood modeling
The CO2 flood performance for the first 30 patterns (Phases 1A and 1B) was predicted using an element of symmetry reservoir model tuned using dimensionless performance data from analog heterogeneous CO2 floods. Geologic and reservoir characterization were used to scale the model to the initial flood area. Before extending the flood beyond the first 30 patterns and armed with pressure and CO2 production history from Phase 1A, Oxy developed a detailed geologic model in Petrel and a reservoir model using MORE.
The fine-scale geologic model contained 230 layers and was based on log data from more than 200 wells. Zonal flow characteristics and repeat formation tester (RFT) data formed the bases for up-scaling the geologic model to 40 layers for use in the reservoir simulator.
CO2 flood performance for Phases 1C and beyond were predicted using a MORE simulator in full compositional mode. The simulation area is in Phase 1A and covers 16 patterns containing 62 wells.
History matching production and pressure data from field discovery in 1928 through the waterflood phase and including the early CO2 flood performance was instrumental for tuning the geologic description and creating the robust reservoir model.
Calibrated simulation predictions indicate incremental EOR by pattern will range from 8 to 12% of the original oil-in-place depending on each pattern’s specific geologic and reservoir classification.
CO2 performance
The production curve for the past 5 years shows the rapid production response for the Phase 1A patterns (Fig. 3). Initial oil response and CO2 breakthrough occurred within a month of CO2 injection.
Conformance control of the injectant in this variable reservoir is an important driver for success and is managed on a continuous basis using a rigorous surveillance program that analyzes production data, production-injection logging, and reservoir pressure data.
CO2 injection is about 2.7 times greater than the water injection rate on a Mcf/bbl basis while simulation predicted that it would only be 2 times greater. The designed total CO2 injection rate was therefore achieved with fewer patterns than originally predicted. The average rate is 9 MMcfd/injector and ranges from 4 to 18 MMcfd/well. In comparison, typical West Texas San Andres CO2 floods inject 2-4 MMcfd/well.
The North Hobbs injection plan calls for injecting CO2 continuously until CO2 breakthrough and then making a decision on when to start water-alternating-gas (WAG) injection depending on the GOR in producing wells.
However, one area of the flood in close proximity to the city of Hobbs, NM, was designated to receive only uncontaminated, or “sweet,” CO2 while other areas were designated to inject or recycle the produced H2S contaminated gas. The project initially had few patterns available for recycled-gas reinjection, so that those patterns stayed on CO2 injection longer than anticipated.
As more recycled-gas patterns became ready for CO2 injection, Oxy was able to better control the project GOR in the recycle area with the WAG process. It then increased purchased CO2 to 90 from 65 MMcfd.
The contaminated produced gas is rich in hydrocarbons. Consequently, Oxy is constructing a new recovery plant that will remove 2,000 b/d of natural gas liquids from the recycled gas stream and contribute an additional 18% to liquid sales.
CO2 flood management
Oxy uses an active aggressive reservoir management and surveillance program at Hobbs because of the dynamic nature of this heterogeneous reservoir. To create conditions that maximize areal and vertical sweep efficiency, oil production, minimize gas production, and optimize purchased, and recycled gas injection, the actions required prior to and during CO2 injection include the following:
• Acquire injection profiles with a rigorous schedule, average five/week field wide.
• Obtain bottomhole pressure regularly to assure that the reservoir pressure is greater than the minimum miscibility pressure (200 readings since start of injection).
• Analyze weekly the injection rates and well tests.
• Hold twice weekly group meetings to review pattern performance.
• Manage injection rates and pressures to equalize bottomhole pressures between water and CO2.
• Perform workovers to obtain injection conformance.
• Perform CO2 performance and surveillance at the zone level. ✦


