Richard Nehring, NRG Associates, Colorado Springs
This is the second of three parts examining the Hubbert method and the degree to which it has understated production and estimated ultimate recovery using the San Joaquin Valley and Permian basins as examples.
Geographically, the Permian Basin consists of West Texas and Southeast New Mexico.
For purposes of this analysis it will be defined as Texas Railroad Commission Districts 7C, 8, and 8A, and Chaves, Eddy, Lea, and Roosevelt counties in southeastern New Mexico.
The standard geological definition of the Permian Basin also includes several counties in Districts 7B and 9. They are excluded here because they add only small amounts of oil-just 3% of the basin total-while vastly complicating data compilation.
Permian Basin
The Permian Basin has become recognized as one of the great oil provinces of the world, being one of only two oil superprovinces in the US.
The world has only a dozen oil superprovinces, or basins with at least 25 billion bbl of estimated ultimate recovery. Because of the remote location of the basin and a lack of major surface structures, the first discovery in the Permian Basin did not occur until 1920 (Westbrook field).
Following the application of early geophysical methods in the mid-1920s, the world class giant fields on the Central Basin platform were quickly discovered, beginning with McElroy-Dune (500 million bbl known recovery as of 1964), South Sand Belt (825 million bbl), and Yates (650 million bbl) in 1926, Eunice Area (685 million bbl) in 1929, and Goldsmith-Andector (570 million bbl) in 1934.
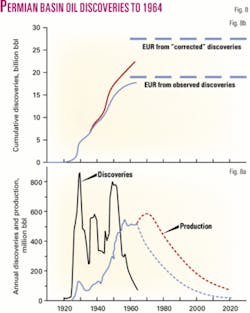
Because of these giant discoveries the annual discovery rate (using 5-year moving averages) reaches its all-time peak of 860 million bbl in 1930, just 10 years after the initial discovery in the basin (Fig. 8a).
Discoveries in the Permian Basin dropped off sharply in the early 1930s following plummeting oil prices created by the entry of flush production from supergiant East Texas field into a market already weakened by falling demand in the early years of the Great Depression.
With the geographical expansion of exploration onto the North Basin Platform in the late 1930s, discoveries rebounded with two giant fields-Slaughter-Levelland (690 million bbl) and Wasson (660 million bbl)-being discovered there in 1936.
After a minor decline during World War II, exploration expanded into the Midland basin in the late 1940s and discoveries approached record heights. Another giant-Scurry (1.240 billion bbl) in 1948-was the most prominent discovery during this period.
Following this last peak, discoveries declined steadily and rapidly throughout the 1950s and into the early 1960s. Observed 1961-64 discoveries, averaging 60 million bbl/year, were more than an order of magnitude less than average discoveries during the 1948-52 peak only 12 years earlier. Reflecting the annual rate of discoveries, cumulative crude oil discoveries grew rapidly in the late 1920s and from 1936 to 1950 (Fig. 8b). After 1950, the cumulative discovery curve flattens markedly.
By 1964, cumulative discoveries in the Permian Basin totaled 17.589 billion bbl. Nearly 28% of this amount was discovered by 1930; nearly 50% by 1940; and 85% was discovered by 1950. The decade from 1941 to 1950 was thus clearly the most prolific decade for basin discoveries.
Because of the large amounts of oil discovered from 1936 to 1955 in the Permian Basin, applying Hubbert’s correction factors to observed discoveries from 1935 to 1964 has a substantial effect on estimated cumulative discoveries.
The “corrected” cumulative discoveries as of 1964 are 22.194 billion bbl, 26.2% more than the observed discoveries as of 1964 (Fig. 8b). Moreover, the peak period of discovery shifts from 1929-30 to 1949-52, average “corrected” discoveries being 1.045 billion bbl/year during this latter period. Discoveries still drop after this peak, but to a substantially lesser degree (Fig. 8a).
The application of the correction factors has an even greater effect on the estimates of ultimate recovery derived from the cumulative discovery curve. With only the observed cumulative discovery curve to go by, it is difficult to see how ultimate crude oil recovery in the Permian Basin could ever exceed 19 billion bbl. Using the “corrected” cumulative discovery curve, an EUR of 27.5 billion bbl (45% more) seems likely.
Following the giant discoveries of 1926, crude oil production in the Permian Basin soared, reaching a peak of 135 million bbl (370,000 b/d) in 1929. The combined effects of flush East Texas field production and declining Depression demand cut production by more than half to only 63 million bbl in 1934, just 5 years later.
From this low point, production grew more or less steadily to a peak of 550 million bbl (1.5 million b/d-21.5% of US crude oil production) in 1957. Following this peak, production stayed at a high plateau, fluctuating between 90% to 95% of the peak rate.
As Hubbert observed, production in the Permian Basin clearly followed discovery, usually with only a 5 to 10 year lag (Fig. 8a). Annual production only finally exceeded the moving average of annual discoveries in 1954.
Projections of future Permian Basin production after 1964 depend heavily on the choice of estimates of EUR. If one uses the estimate of 19 billion bbl (derived from the observed discovery rates), the outlook for future production is rather bleak.
The Permian Basin is a highly mature province from this perspective. Cumulative discoveries are already 92.6% of the EUR. Cumulative production as of 1964 (10.496 billion bbl) is 55.3% of the estimated ultimate. Production from 1960 to 1964 exceeded discoveries more than seven-fold. Remaining ultimate reserves are only 16 times current production.
These key indicators strongly suggest an imminent and rapid decline in annual production to an estimated 216 million bbl in 1980, 59 million bbl in 2000, and only 9 million bbl in 2020 (Fig. 8a). By 2020, the province is projected to be essentially depleted, cumulative production having reached 99.5% of the EUR.
The use of the estimate of 27.5 billion bbl ultimate recovery derived from the “corrected” discovery rates suggests a much brighter future. The “corrected” cumulative discoveries are only 80.7% of the EUR. Cumulative production as of 1964 is only 38.2% of EUR.
Recent production only exceeds recent discoveries by 150%. Remaining ultimate recovery is 32 times current production. These indicators suggest that Permian Basin production could still increase, reaching a peak of 583 million bbl in 1970 (with a cumulative production that year at 50.5% of the estimated ultimate).
After that peak, production will decline at a slowly increasing rate, dropping to 439 million bbl in 1980, 175 million bbl in 2000, and 63 million bbl in 2020. By that year, cumulative production will have reached 96.2% of the EUR.
Permian Basin as of 1982
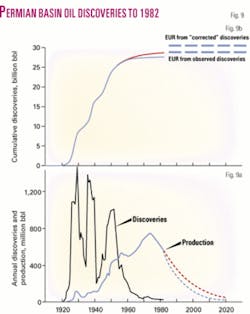
The annual discovery rates for the Permian Basin as of 1982 are an amplified version of those as of 1964. Discoveries (again, using 5-year moving averages) peaked in 1929-30 at a rate of nearly 1.5 billion bbl/year (Fig. 9a).
All told, eight world class giant fields were discovered on the Central Basin platform from 1926 to 1934, beginning with McElroy-Dune (690 million bbl as of 1982), South Sand Belt (899 million bbl), and Yates (2 billion bbl) in 1926, and continuing with Eunice Area (830 million bbl) and Vacuum (550 million bbl) in 1929, North Cowden (515 million bbl) in 1930, South Cowden (535 million bbl) in 1932, and Goldsmith-Andector (870 million bbl) in 1934.
With the giant discoveries on the North Basin Platform in 1936-Seminole (500 million bbl), Slaughter-Levelland (1.9 billion bbl), and Wasson (2.05 billion bbl), the discovery rate rebounded from its Great Depression low.
After an early World War II low, discoveries hit their third peak with the discoveries of Scurry (1.610 billion bbl) in 1948 and Spraberry Trend (717 million bbl) in 1949. Together, the 13 world class giant fields discovered in the Permian Basin from 1926 to 1949 had 13.67 billion bbl known recovery as of 1982, 49% of the basin total.
After 1950, discoveries in the Permian Basin declined rapidly. From 1952 to 1962, the 5-year moving average of discoveries declines by an order of magnitude. From 1962 to 1982, it drops another 80%. This reflects the disappearance of giant and large discoveries during this period.
After 1957, no large field (at least 50 million bbl known recovery) was discovered in the Permian Basin. Only four fields with a known recovery between 25 and 50 million bbl were discovered after 1960. After 1970, even 10 million bbl discoveries were becoming rare, with only four occurring from 1971 to 1982.
The cumulative discovery curve for the Permian Basin reflects these patterns in the annual rate of discoveries. By 1982, cumulative discoveries in the Permian Basin were 27.943 billion bbl (Fig. 9b). The bulk of these discoveries occurred in the late 1920s, the late 1930s, and the late 1940s. By 1930, 31.5% of these cumulative discoveries had already occurred.
By 1940, cumulative discoveries had reached 58.8% of 1982 ultimate recovery and by 1950 they were up to 86.0%. The flattening of the cumulative discovery curve becomes particularly pronounced after 1965. Only 2.2% of the cumulative discoveries in the Permian Basin occur from 1966 to 1982.
Because of the low annual rates of discovery in the Permian Basin in the 25 years from 1958 to 1982, the application of correction factors has little effect on cumulative discoveries.
“Corrected” cumulative discoveries as of 1982 are estimated at 28.845 billion bbl, only 3.2% more than the observed amount. (In the quarter century preceding 1982, in no year did observed discoveries exceed 150 million bbl. In the decade 1973-82, observed discoveries never exceed 50 million bbl in any year.)
Estimates of ultimate recovery for the Permian Basin derived from observed and corrected cumulative discovery curves thus do not differ substantially. The estimate from the observed curve is 28.5 billion bbl. The estimate from the “corrected” curve is 30.5 billion bbl, only 7% higher.
Crude oil production in the Permian Basin grew steadily from 1964 to 1974. In 1966, the previous peak of 550 million bbl was easily exceeded, production reaching 588 million bbl. At the ultimate peak in production of 746 million bbl in 1974 (2.04 million b/d), the Permian Basin was providing nearly a fourth (24.6%) of all US crude oil production.
Cumulative production at this peak was 17.902 million bbl, 64.1% of observed cumulative discoveries as of 1982 and 62.1% of “corrected” cumulative discoveries as of 1982. Following the 1974 peak, production in the basin dropped nearly 25% to 561 million bbl in 1982.
It is obvious that production would continue to decline after 1982. Cumulative discoveries as of 1982 were between 94.6% (“corrected”) and 98% (observed) of EURs. Cumulative production as of 1982 (at 22.385 billion bbl) was between 73.4% (“corrected”) and 78.5% (observed) of EURs. Annual production, though declining, was more than 20 times the rate of annual discoveries.
Ultimate remaining reserves were only 10.9 (observed) to 14.5 (“corrected”) times 1982 production. Given this universally depressing combination of indicators, the only remaining uncertainty was whether production would decline rapidly or very rapidly.
If the EUR is only 28.5 billion bbl, production is halved in less than every nine subsequent years, dropping to 288 million bbl in 1990, 119 million bbl in 2000, and only 16 million bbl in 2020. By 2020, the Permian Basin would be effectively depleted, as cumulative production has reached 99.5% of ultimate recovery.
The decline in production is slower, but only relatively, if ultimate recovery is 30.5 billion bbl. Production declines to 342 million bbl in 1990, 175 million bbl in 2000, and 39 million bbl in 2020 (only 7% of 1982 production). Even with this more “optimistic” projection, cumulative production has reached 98.3% of ultimate recovery by 2020.
Permian Basin as of 2000
The annual discovery curve for the Permian Basin from 1920 to 2000 maintains the basic pattern of the discovery curves as of 1964 and 1982, but with a few significant changes.
Discoveries still grew rapidly in the late 1920s, bolstered by the concentration of giant discoveries during this period. These include the newly recognized giant Howard-Glasscock (514 million bbl known recovery in 2000) in 1925, McElroy-Dune (861 million bbl), South Sand Belt (989 million bbl), Yates (2 billion bbl), Eunice Area (1.065 billion bbl), Vacuum (748 million bbl), North Cowden (770 million bbl), South Cowden (653 million bbl), and Goldsmith-Andector (1.022 billion bbl).
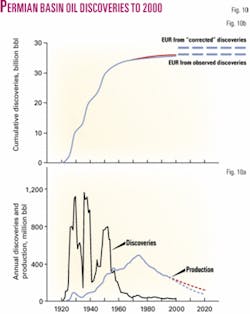
Four other fields discovered from 1923 to 1934 appear likely to eventually join the ranks of world class giant oil fields, including Artesia-Maljamar in 1923 (463 million bbl), Penwell-Waddell in 1926 (423 million bbl), Hobbs in 1928 (425 million bbl), and Means-McFarland in 1934 (391 million bbl). These discoveries pushed average discoveries up to more than 1.7 billion bbl/year in 1929-30 (Fig. 10a).
This peak however was quickly exceeded in 1936 with the discoveries of Seminole (720 million bbl), Slaughter-Levelland (2.457 billion bbl), and Wasson (2.66 billion bbl). Another emerging giant, Robertson-Flanagan (455 million bbl), was also discovered that year.
Despite the discovery of a recently recognized giant in 1941, Fullerton Area (560 million bbl), discoveries dropped during the early 1940s, only to soar again in the late 1940s as Scurry (1.65 billion bbl), Spraberry Trend (1.303 billion bbl), and another emerging giant (Salt Creek in 1950 with 435 million bbl) were discovered.
The 15 recognized giant fields provided 17.972 billion bbl, 51% of Permian Basin cumulative discoveries as of 2000. The six emerging giants added another 2.592 billion bbl, 7.4% of cumulative discoveries.
Following this third and last peak, discoveries in the Permian Basin begin a steady decline throughout the latter half of the 20th century. After 1957, observed annual discoveries never exceed 200 million bbl. After 1977, they never exceed 100 million bbl. After 1985, they never exceed 50 million bbl.
The cumulative discovery curve for the Permian Basin reflects these changing annual patterns of discovery. By 2000, cumulative discoveries in the Permian Basin were 35.242 billion bbl. By 1930, only a decade after the first discovery in the basin, 29.7% of these discoveries had already occurred.
By 1940, 57.6% of 2000 cumulative discoveries had been made. By 1950, 83.8% had been discovered. By 1960, the midpoint in time of exploration to date, 94% of known recovery as of 2000 had already been discovered. Conversely, only 1.7% of the cumulative discoveries occurred after 1980 (Fig. 10b).
Because recent discoveries have been so small and so relatively few, application of the correction factor does little to change cumulative discoveries. The “corrected” cumulative discoveries as of 2000 are 35.748 billion bbl, only 1.4% higher than the observed cumulative discoveries.
Although the use of the correction factor has only a small effect on cumulative discoveries, it modestly increases the estimate of future discoveries.
Without the correction factor, ultimate recovery in the Permian Basin as of 2000 could be no more than 35.75 billion bbl. Average observed discoveries were dropping around 30% every 5 years after 1985.
With the correction factor, average discoveries decline only 10-15% every 5 years after 1985. This suggests an ultimate recovery around 37.5 billion bbl for the Permian Basin.
Either way, the annual discovery curves and the ensuing estimate for ultimate recovery indicates that the Permian Basin had reached a high level of exploration maturity. Between 95.3% (of the “corrected” EUR) and 98.6% (of the observed EUR) of all the oil likely to be discovered in the Permian Basin had already been discovered by 2000.
The record of crude oil production in the Permian Basin from 1982 to 2000 is essentially one of steady decline, occasionally interrupted by a few minor upward ticks in production (Fig. 10a). Overall, production declines from 561 million bbl (1.54 million b/d) in 1982 to 333 million bbl (0.91 million b/d) in 2000, a decline of 40.6%.
By 2000, cumulative production in the basin was 30,235 million bbl, 85.8% of observed cumulative discoveries and 84.6% of “corrected” cumulative discoveries. The role of the Permian Basin as a major oil producing province thus appears to be largely past.
The future of crude oil production in the Permian Basin can thus be only one of continued decline. Here, too, the only uncertainty is the rate of decline. Recent annual production is more than 20 times the observed rate of discovery. Ultimate remaining reserves (as calculated from the observed rate of discovery) are only 16.6 times 2000 production. Under this scenario, crude oil production in the basin declines to only 99 million bbl in 2020, a decline of 70% from the 2000 level. Cumulative production by 2020 reaches 34.432 billion bbl, 96.3% of the EUR of 35.75 billion bbl.
With the “corrected” discovery curve, recent annual production is approximately seven times the rate of recent discoveries. Ultimate remaining reserves (as calculated from the “corrected” rate of discovery) are 21.8 times 2000 production.
Even under this more optimistic scenario, crude oil production in the Permian Basin falls to 155 million bbl in 2020, only 46.5% of 2000 production. Cumulative production by 2020 is 34.954 billion bbl, 93.2% of the ultimate recovery of 37.5 billion bbl.
Permian Basin summary
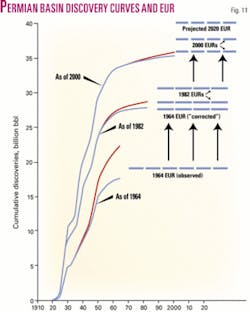
Cumulative discoveries in the Permian Basin increase substantially from 1964 to 2000 (Fig. 11).
That cumulative discoveries increase in a superprovince such as the Permian Basin over a period exceeding a third of a century is not surprising. A universal characteristic of superprovinces is that they have a sizable number of prospects of diverse characteristics and thus require several decades to be explored and developed adequately.
What is surprising about this increase is both its magnitude and its composition. First of all, cumulative discoveries double during what is the second and clearly lesser half of exploration in the basin, a period where few giant and large discoveries remained to be made.
More importantly, relatively little of this increase comes from recent discoveries. Only 9.3% (1.642 billion bbl of the 17.653 billion bbl increase in cumulative discoveries) comes from new field discoveries from 1965 to 2000. Conversely, 82.6% of this increase (14.583 billion bbl) occurs in fields discovered from 1920 to 1950.
Because the cumulative discoveries increase substantially, EUR for the Permian Basin increases substantially as well. The ultimate recoveries (as asymptotes tied to the observed discovery curves) increase from 19 billion bbl as of 1964 to 28.5 billion bbl as of 1982 to 35.75 billion bbl as of 2000, an 88% increase (Fig. 11).
The ultimate recoveries (as asymptotes tied to the “corrected” discovery curves) increase from 27.5 billion bbl as of 1964 to 30.5 billion bbl as of 1982 to 37.5 billion bbl as of 2000, a 36% increase.
The use of the correction factors clearly results in an overestimation of future discoveries for the Permian Basin. As of 1964, future discoveries in the Permian Basin were estimated to be 1.411 billion bbl using the observed discovery curves and 5.306 billion bbl using the “corrected” discovery curves. By comparison, observed discoveries from 1965 through 2000 were 1.642 billion bbl, only 16.4% more than the observed prediction but 61.9% less than the “corrected” prediction.
“Corrected” discoveries for these 36 years were 2.148 billion bbl, only 40.5% of the “corrected” prediction. As of 1982, future discoveries were estimated at 557 million bbl (observed) and 1.655 billion bbl (“corrected”). Observed discoveries from 1983 through 2000 were 498 million bbl or 892 million bbl when “corrected” for further development.
On the other hand, the correction factor used appears to work reasonably well for predicting the ultimate size of prior recent discoveries. The use of Hubbert’s correction factor as of 1982 predicts that the observed discoveries of 333 million bbl from 1971 to 1982 would increase to 727 million bbl.
As of 2000, observed discoveries for 1971-82 were 682 million bbl and “corrected” discoveries for the same period were estimated to be 793 million bbl. Given the usual uncertainties in petroleum resource assessment, the 1982 prediction is turning out to be very accurate.
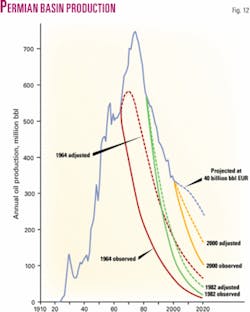
Because ultimate recovery for the Permian Basin as estimated from the 1964 and 1982 data proved to be substantially understated already by 2000, projected production based on these estimates of ultimate recovery fall well below actual production from 1965 to 2000 (Fig. 12).
Both projections as of 1964 miss the 1974 peak in production. Both the prepeak projections of 1964 and the postpeak projections of 1982 overstate the rate of decline and thus understate 2000 production. Actual production in 2000 was 1.9 times both the 1964 and 1982 adjusted projections, 2.8 times the 1982 observed projection, and 5.6 times the 1964 observed projections. Even the projections made from the data through 2000 are already diverging substantially from actual production, the adjusted projection being 7.2% less and the observed projections being 15.3% less than actual 2004 production of 320 million bbl.
The divergence between actual and projected production after 2000 suggests that cumulative discoveries (known recovery) in the Permian Basin should be at least 40 billion bbl by 2020, an increase of 4.758 billion bbl from 2000 to 2020.
By comparison, total reserve additions in the Permian Basin in the 4 years from 2001 to 2004 were 856 million bbl, even after a 375 million bbl reserve reduction in giant Yates field following a transfer of ownership. With these additions, cumulative discoveries as of 2004 were 36.098 billion bbl, a level already greater than the observed EUR as of 2000.
At this level of ultimate recovery, Permian Basin oil production in 2020 would be between 3.7 and 26 times the amounts projected for 2020 production as of 1964 and 1982. Looking further ahead, cumulative discoveries (known recovery) of 45 to 50 million bbl for the Permian Basin as of 2050 seem quite possible, given the basin’s original oil in place of at least 95 billion bbl as of 2000.
Next: Why the Hubbert method fails and responses to attempted rebuttals.
