HUBBERT’S UNRELIABILITY-1: Two basins show Hubbert’s method underestimates future oil production
When will world oil production peak?
This question, which only a few years ago was the concern of just several dozen specialists worldwide, is now a front-page issue. The obvious reason for its current salience is the recent doubling of crude oil prices, which show no sign of dropping below $30/bbl.
The immediate causes of this increase are readily apparent: rapid recent growth in oil demand in South and East Asia, insufficient investment in oil production capacity (particularly in those countries where such investment directly competes with other politically determined expenditures), and disruptions in oil supply, whether from natural disasters such as hurricanes Katrina and Rita or from political turmoil in several major petroleum exporting countries.
Underlying these immediate causes is the nagging concern that the world oil resource base is inadequate for even sustaining much less increasing world oil production in the decades ahead.
The opening question quickly leads to a second question: Can we predict when world oil production will peak?
Do we know the key factors that determine world oil production? Do we understand how these factors behave and interact well enough to develop methods for predicting world oil production? Do these predictions provide a reliable foundation for decisions?
Discussion of a peak in world oil production, in both narrow technical circles and the broader public, has been dominated by one method of prediction: the method developed by M. King Hubbert in a series of articles 40-50 years ago. Hubbert based his analysis on deductions and extrapolations from two curves, one showing annual discoveries of oil, the other showing annual production of oil.
Both discoveries and production began at zero, grew to a peak, and subsequently declined to zero. The area under each of these curves equaled ultimate recovery of oil. Production necessarily succeeded discovery. Hubbert observed that in the US the lag between discovery and production appeared to be 10-12 years.
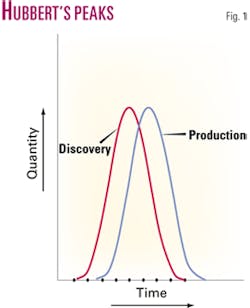
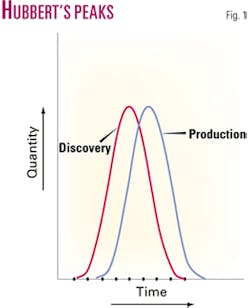
Thus, once annual discoveries peaked and began to decline, the peak and subsequent decline of production could be predicted reliably. The peak in production has become popularly known as “Hubbert’s Peak.” It is more accurate to speak of Hubbert’s Peaks (Fig. 1). Both the annual discovery curves and the annual production curves with their respective peaks are essential to the Hubbert method.
Hubbert also used a third curve, that of proved reserves over time. This curve is no longer necessary for the application of his method. Hubbert used it because the data sources available in the 1950s and early 1960s for measuring annual discoveries were poor. However, good historical data series did exist then for both annual production and annual proved reserves of crude oil.
Since cumulative discoveries at any point in time are equal to the sum of cumulative production and proved reserves at that time, the cumulative discovery curve can be estimated by summing the cumulative production and proved reserves curves. By working backward from the cumulative discovery curve, the annual discovery curve can be determined as well.
Given the data Hubbert used, his “annual discovery curve” is more accurately termed an annual gross reserve additions curve. With the excellent field databases available today, both the annual and the cumulative discovery curves can be determined directly, making such convoluted indirect approaches unnecessary.
Hubbert argued that both the annual discovery and the annual production curves were single-cycle curves; that is, each would have only one peak. Neither would be a multiple-cycle curve with two or more peaks substantially separated in time.
Moreover, he argued that both curves were horizontally symmetrical; that is, the peaks in both the annual production and the annual discovery curves occurred when cumulative discoveries and cumulative production were approximately 50% of ultimate recovery.
The key to predicting production accurately using the Hubbert method is to have an accurate estimate of ultimate recovery. An accurate estimate of ultimate recovery is necessary because annual discovery curves, contrary to Hubbert’s argument, tend to be highly irregular. Most have multiple peaks.
The trick is thus to identify the true ultimate peak and not be misled by earlier peaks. One wonders when Hubbert would have predicted the peak in US oil production if he had first tried to do so in 1935 following the drastic decline in discoveries in the early 1930s or in 1945 following the nearly as dramatic decline in discoveries in the early 1940s.
If the observed peak in discoveries occurs when cumulative discoveries are approximately 50% of ultimate recovery, one can-at least according to Hubbert-confidently assume that the observed peak is the ultimate peak and proceed accordingly.
Hubbert struggled with several approaches to predicting ultimate recovery in his papers of the late 1950s and early 1960s.
By 1965, following the peak and beginning of the decline he observed in annual oil discoveries in the US, he concluded that ultimate recovery could be reliably determined using information intrinsic to his method. The cumulative discovery curve, constructed from the annual discovery curve, provides the means for estimating ultimate recovery.
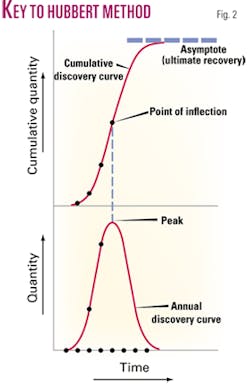
The cumulative discovery curve ultimately is an S-shaped curve. It begins at zero and accelerates its rise until annual discoveries reach their peak. As annual discoveries begin to decline, the cumulative discovery curve begins to flatten out, eventually approaching an asymptote as annual discoveries near zero. The amount at this asymptote equals ultimate recovery (Fig. 2).
This approach clearly has limitations. Its principal limitation is that it cannot be used until annual discoveries have clearly passed their peak. Hubbert never specified what the minimum ratio of cumulative discoveries to ultimate recovery had to be for this approach to yield a reliable estimate of ultimate recovery.
In his papers of the late 1960s (Hubbert, 1967 and 1969), the ratio of cumulative discoveries to his estimate of ultimate recovery was between 70 and 80%. Perhaps this ratio could be as low as 65%. At any point less than that, extrapolation of the cumulative discovery curve becomes increasingly uncertain.
The use of this method also requires careful interpretation of the annual discovery curve. Hubbert, using research published by the National Petroleum Council in the late 1950s and early 1960s, recognized that the initial reports of the amounts discovered in recent finds persistently understated the amounts that would ultimately be recovered from these fields.
Thus these initial reports had to be adjusted upward using empirically derived growth factors. Failure to make this adjustment results in an unduly pessimistic estimate of ultimate recovery and thus an erroneously low prediction of future production.
The first two parts of this article will demonstrate how the method underestimated recovery in the San Joaquin Valley and Permian Basin, respectively. The third part will explain why the method fails and offer responses to attempted rebuttals.
Testing Hubbert’s method
This article systematically and rigorously tests the Hubbert method as a tool for predicting future oil production.
The basic approach is simple. It is to apply the method to two major US oil-producing basins: the San Joaquin Valley in California and the Permian Basin in West Texas and Southeast New Mexico.
It applies the method to each of these basins as of three points in time: 1964, 1982, and 2000.
It uses the fundamental components of the method to predict production to 2020 for each basin from each of these 3 years and then compares these predictions with actual production through 2004.
The fundamental components of the Hubbert method examined for each basin as of each year are annual discoveries, annual production, and the cumulative discovery curve.
Annual discovery and annual production curves were constructed from the beginning of discovery and production through each specified year. Because annual discovery curves are highly irregular, the discovery curves presented were constructed using a trailing 5-year moving average of actual discoveries.
Because discoveries were few and far between in the San Joaquin Valley before 1920, a trailing 10-year moving average was used to construct the discovery curves for that period in that basin. The use of moving averages begins to approximate the derived smooth curves that Hubbert used in his analysis.
Because the peaks of the annual discovery and production curves are central to Hubbert’s method, each is noted and discussed. Cumulative discoveries and production at each peak in annual discoveries and production are explicitly noted.
Because the annual discovery curves provide the foundation of Hubbert’s method, the key factors shaping them, namely the timing and then-current size of world-class giant discoveries (those with 500 million bbl or more ultimate recovery), are indicated as well.
The most recent 30 years of each annual discovery curve is also adjusted for future growth resulting from full development of the more recent discoveries. The growth factors used are taken from Hubbert (1967). This adjustment is made to correct the observed sizes of the more recent discoveries to their ultimate potential.
Growth is cut off after 30 years because the growth factor used by Hubbert has declined to less than a 10% adjustment from known to ultimate for such older discoveries. The growth factors used by Hubbert were derived from US experience in the 1940s and 1950s. Because it is uncertain whether this particular past growth experience is relevant to future growth, these adjustments are noted as “corrected” estimates.
Cumulative discovery curves were then derived for each basin as of each year from both the actual and the “corrected” annual discovery curves. Ultimate recovery (EUR) was then estimated for each basin according to the information available for each of the specified years by extending both the actual and the “corrected” cumulative discovery curves to their asymptotes.
Because each of these basins was at a high degree of exploration maturity for each of these years (in all cases, cumulative discoveries exceed 80% of EUR and in most cases they exceed 90% of EUR), there was negligible uncertainty associated with estimating ultimate recovery.
Cumulative production as of each year was then subtracted from EUR to obtain ultimate remaining reserves.
Production was then projected for each basin as of each year and for each estimate of ultimate recovery out to 2020. These projections assumed, following Hubbert, that annual production peaks when cumulative production is roughly half of ultimate recovery. The projections assume a gradually increasing rate of production decline from observed recent rates of decline, with a limit on the basin decline rate of no more than 10%/year.
Each basin discussion concludes with a comparison of the cumulative discovery curves and the associated estimates of ultimate recovery for all 3 years. Projected production as of 1964, 1982, and 2000 is also compared with actual production through 2004.
San Joaquin Valley
Geographically, the San Joaquin Valley is the southern half of the great Central Valley of California.
For the past century, it has been an important center of US oil production, being one of only eight major oil provinces in the country (a major province as used here is one with expected ultimate oil recovery of at least 8 billion bbl).
Oil exploration and discovery in the San Joaquin Valley has a long history, going back to the late 19th century. The first discovery in the basin was the world-class giant Coalinga field in 1887 (610 million bbl cumulative production as of 1964). This was the first giant oil field discovered in any major US oil province.
The other known giant fields in the basin as of 1964 were discovered in the next quarter century, beginning with Midway-Sunset in 1901 (1.1 billion bbl) and concluding with Buena Vista in 1909 (615 million bbl).
After this brief spurt in discovery, exploration in the basin dwindled to negligible levels in the early 1920s following a series of major discoveries from 1917 to 1924 in the Los Angeles Basin 150 miles to the south.
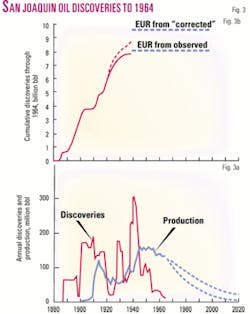
Discoveries resumed at a healthy rate during the late 1920s, plunged again in the early years of the Great Depression, and reached their peak of 303 million bbl/year in 1941 (based on a 5-year moving average).
From that peak, discoveries plummeted, averaging only 24-32 million bbl/year by 1954-61. By 1964, average annual discoveries for the 5 years 1960-64 had dropped to 15 million bbl, only 5% of the 1941 peak (Fig. 3a).
Reflecting the annual rate of discoveries, cumulative crude oil discoveries grew rapidly through 1915, leveled off for a decade, then grew rapidly again for the next quarter century before flattening out in the 1950s (Fig. 3b). By 1964, 7.745 billion bbl had been discovered in the San Joaquin Valley. Nearly half (48.5%) of this amount had been discovered by 1915. By 1940, nearly 80% of known recovery as of 1964 had already been discovered.
If Hubbert’s correction factors are applied to San Joaquin Valley discoveries, cumulative discoveries through 1964 increase modestly. The “corrected” known recovery as of 1964 is 8.655 billion bbl, 11.7% more than the observed amount (Fig. 3b).
The 5-year moving average of discoveries still peaks in 1941, but at 353 million bbl. Discoveries still plummet after this peak, but only to a level of 50-60 million bbl from 1956 to 1964.
The correction factors have a substantial effect on the estimates of ultimate recovery derived from the cumulative discovery curve. Using only the observed discovery rate with its rapidly declining discovery rate from 1950 to 1964, estimating ultimate recovery for the San Joaquin Valley beyond 8 billion bbl would have no justification in the historical discovery record.
The “corrected” discovery rate, which has substantial year-to-year fluctuations and depends heavily on a handful of moderately-sized discoveries, suggests an EUR around 9.5 billion bbl, nearly 20% higher.
Crude oil production in the San Joaquin Valley grew slowly in its first 20 years before taking off in 1910 (Fig. 3a). By 1914, it hit its first peak of 124 million bbl (340,000 b/d). A combination of declines from natural depletion and competition from Los Angeles Basin production led to an overall decline in production to only 49 million bbl in 1928-29.
From that low, production grew steadily to its historic peak of 161 million bbl (440,000 b/d) in 1945. Production subsequently stayed at a high plateau through 1956 before beginning to decline slowly in the early 1960s. By 1950, annual production exceeds annual discoveries for good.
Although the annual discovery and production curves for the San Joaquin Valley do not follow the smooth single-peak curves that Hubbert postulated, they clearly illustrate two key points of his analysis.
First, production closely follows discovery. The 2 peak years of production (1914 and 1945) follow peaks in discovery by 5 to 10 years.
Second, peak production occurs when cumulative production is at or near the midpoint of ultimate recovery. Cumulative oil production in 1945 was 3.003 billion bbl, 37.5% of the estimated ultimate of 8 billion bbl. By 1956, the end of the peak plateau in production, cumulative oil production was 4.677 billion bbl, 58.5% of the estimated ultimate.
If the EUR of 9.5 billion bbl is used instead, cumulative production in 1956, the last year of the peak plateau in production, was 4.678 billion bbl, 49.2% of the “corrected” EUR.
The historic discovery and production data for the San Joaquin Valley thus appears to provide a solid basis for accurately predicting future oil production. By 1964 the San Joaquin Valley was clearly a highly mature oil province.
Between 91% (using the “corrected” numbers) and 97% (using the observed numbers) of all the oil estimated to be ultimately recoverable in the basin had been discovered. Cumulative production of 5.759 billion bbl was between 60.6% (“corrected”) and 72% (observed) of ultimate recovery. Moreover by 1960-64, production was clearly exceeding the rate of discovery.
The average production of 133 million bbl/year was nine times the observed average rate of discovery of 15 million bbl/year and more than double the “corrected” rate of discovery of 63 million bbl/year. The decline in production that had begun in the 1950s was thus destined to continue. The only remaining uncertainty was which ultimate recovery estimate and thus which decline rate to use in projecting production.
With an EUR of 8 billion bbl, only 2.241 billion bbl remained to be produced after 1964. Projected production thus declines rapidly to only 58 million bbl in 1980, 16 million bbl in 2000, and less than 3 million bbl in 2020. By that year San Joaquin Valley would be close to total depletion, having produced 99.7% of its ultimate recovery.
With an EUR of 9.5 billion bbl, 3.741 billion bbl remained to be produced after 1964. Projected production thus declines more slowly to 83 million bbl in 1980, 41 million bbl in 2000, and 18 million bbl in 2020. By then, the basin would have produced 96.7% of its EUR.
San Joaquin as of 1982
Moving forward to 1982, what was then known about the San Joaquin Valley had changed substantially from the situation as of 1964.
Cumulative crude oil discoveries as of 1982 were 11.77 billion bbl, 52% more than cumulative discoveries as of 1964. “Corrected” cumulative discoveries were 11.944 billion bbl, 38% more than “corrected” cumulative discoveries as of 1964.
This increase was not primarily the result of major new discoveries during the 1960s and 1970s. Rather, by 1982 seven fields in the basin were now recognized as world-class giant fields, with all but one discovered by 1911.
These included Coalinga in 1887 (785 million bbl known recovery as of 1982), Kern River in 1899 (1.75 billion bbl), Midway-Sunset in 1901 (2.09 billion bbl), Buena Vista in 1909 (657 million bbl), South Belridge in 1911 (750 million bbl) and Elk Hills in 1911 (1.3 billion bbl), and Coalinga East Extension in 1938 (505 million bbl).
Together, these seven fields accounted for two-thirds of the observed cumulative discoveries in the basin.
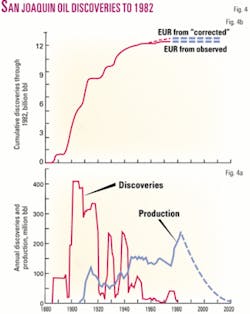
Because of the concentration of giant discoveries between 1899 and 1911, the peak discovery period as of 1982 has shifted to the first decade of the century, peaking (using a 10-year moving average) at 405 million bbl/year from 1901 to 1905. As before, two lesser peaks in discovery occur in the late 1920s and late 1930s.
Except for two major discoveries at Tule Elk in 1973 and Yowlumne in 1974, the first new field discoveries exceeding 50 million bbl in the San Joaquin Valley since 1944, discoveries since 1964 were minimal with no new field discoveries in 11 of the 18 years 1965-82.
Consequently, the application of correction factors to the discoveries of the past 30 years has a minor effect, increasing known recovery as of 1982 by only 174 million bbl, 1.5% of the observed total (Figs. 4a and 4b).
The cumulative discovery curve reflects these changes in the annual pattern of discoveries. Cumulative discoveries soar from 1895 to 1915, reaching 69.4% of 1982 known recovery by 1915. By 1940, cumulative discoveries have reached 90.7% of 1982 known recovery.
After 1950 (when cumulative discoveries were already 96.8% of 1982 known recovery), cumulative discoveries inch up at a barely perceptible rate.
The flattening of annual discovery rates after 1950 leaves little room for future discoveries. Consequently, ultimate recovery for the San Joaquin Valley is estimated as of the end of 1982 to be between 11.9 billion bbl (using observed discovery rates) and 12.1 billion bbl (using “corrected” discovery rates).
The changing patterns of peak discoveries alter the relationships between discovery and production substantially. More importantly, crude oil production in the San Joaquin Valley, after declining to 123 million bbl in 1974, suddenly takes off, nearly doubling to 245 million bbl in 1982.
That year becomes the new historic peak in San Joaquin Valley crude oil production, exceeding the previous peak of 1945 by 52%. More importantly this sudden increase is inexplicable according to the Hubbert model.
If one applies the insights of the Hubbert model to this situation, one can only conclude that this sudden increase in production was a totally aberrant situation. By 1982, cumulative crude oil production of 8.692 billion bbl was 72-73% of EUR.
Average annual production in 1978-82 was more than two orders of magnitude greater than average annual discoveries during the same 5 years. Remaining reserves were less than 14 times 1982 production, even by the “corrected” estimate of ultimate recovery.
An immediate and rapid decline in production thus is clearly indicated. By 2000, production is projected to be only 69 million bbl. By 2020, production will have declined to only 13 million bbl, just 5% of the 1982 peak.
Cumulative production that year will have reached 98% of ultimate recovery. Only the prediction from the “corrected” estimate of ultimate recovery is shown in Fig. 4a because of the negligible difference between it and the prediction from the observed estimate.
San Joaquin as of 2000
From 1982 to 2000, known oil recovery in the San Joaquin Valley again increased substantially.
As of 2000, cumulative crude oil discoveries in the basin were 16.068 billion bbl, 107% more than cumulative discoveries as of 1964 and 37% more than cumulative discoveries as of 1982. “Corrected” cumulative discoveries were 16.111 billion bbl, 86% more than “corrected” discoveries as of 1964, and 35% more than “corrected” discoveries as of 1982.
New discoveries from 1983 to 2000 were a trivial part of the 4.3 billion bbl increase in cumulative discoveries from 1982 to 2000. Only 31 million bbl (0.7%) of this increase came from new field discoveries in the basin after 1982.
Nearly all of the increase occurred in the giant fields discovered by 1911, including Coalinga (965 million bbl known recovery as of 2000), Kern River (2.3 billion bbl), Midway-Sunset (3.596 billion bbl), Buena Vista (674 million bbl), the newly recognized giant 1909 discovery Cymric (500 million bbl), South Belridge (1.86 billion bbl), and Elk Hills (1.383 billion bbl). An eighth field, Lost Hills, discovered in 1910, was rapidly growing and appears likely to reach world-class oil giant status before 2010.
These eight fields contained 72.8% of cumulative discoveries as of 2000. With Coalinga East Extension, a 1938 discovery, the world-class giants accounted for 76.5% of all the basin’s oil.
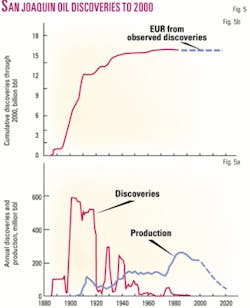
Because of the increasing concentration of known recovery in the 1899-1911 giant discoveries, the peak discovery period is even more prominent during this period (Fig. 5a).
Using the 10-year moving average, the peak discovery rate occurred from 1901 to 1905 at 590 million bbl/year. As before, lesser peaks in discovery occur in the late 1920s and late 1930s.
After 1975, new field discoveries in the basin dwindle to insignificant levels, exceeding 10 million bbl in only 1 year and being zero in 18 of the 25 years. Thus, the application of the correction factors has only a trivial effect, increasing cumulative discoveries by just 43 million bbl (0.3%).
As of 2000, cumulative discoveries are even more concentrated from 1895 to 1915, reaching 76.1% of known recovery as of 2000 by 1915 (Fig. 5b). By 1940, cumulative discoveries were 92.2% of 2000 known recovery.
The nearly flat cumulative discovery curve after 1975 provides almost no encouragement for future discoveries. Consequently, ultimate recovery for the San Joaquin Valley estimated from the 2000 data is between 16.1 billion bbl (using the observed discoveries) and 16.15 billion bbl (based on the “corrected” discoveries).
For a few years after 1982, crude oil production in the San Joaquin Valley continued to defy Hubbert’s rules, reaching its peak in 1985 at 272 million bbl (745,000 b/d). Cumulative crude oil production that year was 9.473 billion bbl, 58% of the estimated “corrected” ultimate.
Following this peak, normality finally prevailed and production began a more or less steady decline to 218 million bbl in 2000 (Fig. 5a). From 1980 to 2000, production exceeded discoveries by more than two orders of magnitude.
With cumulative production in 2000 at 13.031 billion bbl, 80.7% of the estimated ultimate recovery of 16.15 billion bbl, it seems an absolute certainty that oil production will continue to decline. By 2020, oil production is expected to drop to 57 million bbl, only 21% of the 1985 peak.
San Joaquin summary
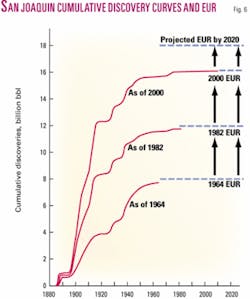
From 1964 to 2000, the cumulative discovery curves for crude oil in the San Joaquin Valley change dramatically (Fig. 6).
Observed cumulative discoveries increase from 7.745 billion bbl in 1964 to 11.77 billion bbl in 1982 to 16.068 billion bbl in 2000, an increase of 107.5%. “Corrected” cumulative discoveries increase from 8.655 billion bbl in 1964 to 11.944 billion bbl in 1982 to 16.111 billion bbl in 2000, an increase of 86%.
Because of these increases, the projected ultimate recovery levels, as determined by the asymptotes indicated by the cumulative discovery curves, change as well. Using asymptotes based on the observed discovery curves, EUR increases from 8 billion bbl as of 1964 to 11.9 billion bbl as of 1982 and 16.1 billion bbl as of 2000, an increase of 101%.
Using asymptotes based on the “corrected” discovery curves, EUR increases from 9.5 billion bbl as of 1964 to 12.1 billion bbl as of 1982 and 16.15 billion bbl as of 2000, an increase of 70%.
The estimates based on the observed discovery curves appear to have greater historical verification. The correction factors used were based mainly on observed increases in size of the giant and large discoveries of the 1920s, 1930s, and 1940s. They appear to overstate increases in size over time of the much smaller discoveries of the 1950s and 1960s.
Consequently, estimates of future discoveries based on the “corrected” discovery curves overstate future discoveries. For example, the estimates of ultimate recovery made using data as of 1964 suggest future discoveries of 255 million bbl (using the observed data) and 845 million bbl (using the “corrected” data).
Actual new field discoveries from 1965 to 2000, with none after 1989, totaled 287 million bbl as of 2000, only 12.5% more than the estimate from the observed data.
Despite an increase of 8.1 billion bbl in EUR from 1964 to 2000, the San Joaquin Valley is not yet finished as an oil province. Reserve additions from 2001 to 2004 totaled 466 million bbl, raising known recovery to 16.534 billion bbl.
Propelled by the impetus of higher prices that began in 2004, increases in known recovery to at least 18 billion bbl by 2020 appear highly probable. With original oil in place of at least 38-40 billion bbl in the San Joaquin Valley, a known recovery of 20 to 22 billion bbl by 2050 is a distinct possibility.
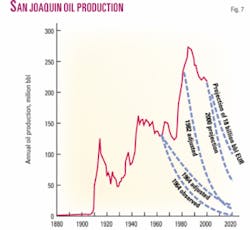
Because ultimate recovery based on the 1964 and 1982 data is grossly underestimated, future production projected from these data is grossly underestimated as well. For example, actual production of 218 million bbl in 2000 was 13.7 times the projected production of 16 million bbl for 2000 from the 1964 observed EUR, 5.3 times the projected production of 41 million bbl from the 1964 “corrected” EUR, and 3.15 times the projected production of 69 million bbl from the 1982 “corrected” EUR (Fig. 7).
Assuming that known recovery in the basin by 2020 will be at least 18 billion bbl widens this discrepancy. Actual production in 2004 of 191 million bbl is consistent with a known recovery of 18 billion bbl by 2020.
Production under this scenario would be nearly double that predicted for 2020 from 2000 EUR, nearly 8 times production predicted from 1982 EUR, and 34 times production predicted from 1964 (observed data) ultimate recovery.
Next (Apr. 17): How the Hubbert method fared in predicting Permian Basin production. ✦
The author
Richard Nehring ([email protected]) has been president of NRG Associates, which he founded, since 1983. From 1973 to 1983 he was a fossil fuel supply analyst at The RAND Corp. He is currently chair of the organizing committee for the forthcoming AAPG Hedberg Research Conference on Understanding World Oil Resources. He has a BA in history from Valparaiso University, a BA in philosophy, politics, and economics from Oxford University, and was a PhD student in political science and economics at Stanford University.
