Global ethylene capacity grows 4% in 2005
The global ethylene industry added 4.4 million tonnes/year (tpy) of capacity in 2005, an increase from the 2004 addition rate of 2.1 million tpy, according to the latest ethylene survey.
Capacity as of Jan. 1, 2006, was 117.3 million tpy, an increase from a worldwide capacity of 112.9 million tpy as of Jan. 1, 2005. This is an increase of nearly 4%.
The latest survey lists nearly 3 million tpy of capacity starting up in four new plants; no capacity was removed from the survey due to idled or shutdown plants. The remainder of additional capacity resulted from expansions at existing sites, capacity creep, and debottlenecking.
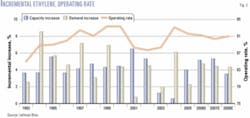
Fig. 1 shows that 2005 was the second consecutive year of a rise in capacity additions. Capacity additions had fallen each year through 2003 when they reached a nearly 2-decade low. Additions should decrease slightly in 2006 if all announced projects go online.
Fig. 2 shows that global operating rates fell slightly in 2005 from a high of about 93% in 2004. This is still a significant rise from the operating levels in 2001-03, when rates ran less than 90% due to stagnant demand. With significant capacity slated to come online in 2006-10, operating rates should continue to decrease.
Most future growth in ethylene capacity will occur in the Middle East and Asia due to feedstock advantages. North America and Western Europe will experience relatively flat capacity growth. North American capacity growth will continue to be limited due to high natural gas costs.
New units
Four new ethylene units appear in this year’s survey: two in China, one in Brazil, and the other in Saudi Arabia. A 600,000-tpy plant in Nanjing, China, owned by BASF-YPC Co. Ltd., a 50-50 joint venture between BASF AG and Sinopec, started up in 2005. Originally scheduled to start up in 2004, the steam cracker and nine downstream plants started commercial production in June 2005.
The $2.9 billion plant will produce 1.7 million tpy of chemicals and polymers for the Chinese market.
A joint venture of China National Offshore Oil Corp. (CNOOC) and Shell Petrochemicals Co. Ltd. (SPC) produced on-specification ethylene and propylene on Jan. 29 at the new petrochemicals complex at Daya Bay in Huizhou, Guangdong Province, China.
The $4.3 billion Daya Bay plant will produce 2.3 million tpy of products primarily for Guangdong and other high-consumption areas of China’s southeast coastal economic zones. Central to the complex is a condensate or naphtha cracker producing 800,000 tpy of ethylene and 430,000 tpy of propylene.
Although the plant started up after Jan. 1, 2006, OGJ is including it in the 2005 survey since the plant had completed construction.
Rio Polimeros, a consortium of four companies that includes Uniao de Industrias Petroquimicas and Petroleo Brasileiro SA, started up a 520,000-tpy plant in Duque de Caxias, Brazil. The ethylene plant, which cost $1.08 billion, sits next to the Duque de Caxias refinery.
Jubail United Petrochemical Co., a fully owned subsidiary of Saudi Basic Industries Corp. (Sabic), started up a 1-million-tpy plant in late 2004. The plant did not appear in the survey for 2004, however, because OGJ could not confirm the start-up date.
Regional review
Table 1 shows rankings of the 10 largest ethylene production complexes in the world. Nova Chemical Corp.’s Joffre plant retains the top spot on the list. There is one newcomer to the list and a few others moved positions due to changing capacities.
ChevronPhillips Chemical Co.’s Sweeney, Tex., complex experienced a decrease in capacity, to 1.868 million tpy from 1.905 million tpy reported in last year’s survey. The plant remained the fourth largest ethylene plant in the world.
Dow Chemical Co.’s Terneuzen, Netherlands, plant increased capacity 50,000 tpy to 1.8 million tpy, which gave the plant sole possession of fifth on the list. Dow’s Freeport, Tex., plant also increased ethylene production capacity 100,000 tpy to 1.64 million tpy.
The newcomer to the list is Ineos Olefins & Polymers USA’s Chocolate Bayou, Tex., plant. The plant was previously owned by BP PLC. On Mar. 22, 2005, BP announced that it was splitting off its olefins and derivatives subsidiary and renaming it Innovene. Then on Oct. 7, 2005, BP sold Innovene to Ineos for $9 billion. The deal was finalized on Dec. 16.
Before the acquisition, Innovene had increased the capacity of the Chocolate Bayou plant to 1.752 million tpy from 1.451 million tpy.
A wholly owned subsidiary of Lyondell Chemical Co., Equistar Chemicals LP’s Channelview, Tex., plant, fell two spots and Formosa Plastics Corp.’s Point Comfort, Tex., plant fell off the list.
Table 2 ranks ethylene production capacity by region. Asia-Pacific added 1.5 million tpy and the Middle East and Africa added more than 1.1 million tpy. The other regions showed significant increases in capacity.
On a percentage basis, South America and the Middle East showed the most significant growth. South America showed the greatest increase (12.6%) due to the new Rio Polimeros plant and because the region has the least amount of production. The Middle East and Africa region increased capacity more than 10%, mainly due to the start-up of the Jubail plant.
Table 3 ranks ethylene production capacity by country. China showed the largest increase in capacity of 1.65 million tpy due to two new plants. Saudi Arabia had the second largest increase, 1 million tpy, followed by Brazil with 520,000 tpy.
Poland and the US both increased capacity more than 300,000 tpy. The increase in Poland was because PKN Orlen SA completed a revamp of its Olefin II unit in October 2005. The revamp increased the Plock-based plant’s capacity to 700,000 tpy from 360,000 tpy reported in last year’s survey.
Most of the increase in the US was due to the Ineos plant expansion. A smaller expansion of 90,000 tpy was reported in DuPont’s Orange, Tex., plant.
Smaller increases of 100-150,000 tpy occurred in Austria, Norway, South Africa, and Turkey.
Closed, idled plants
Table 3 also shows that only three countries experienced a net decrease in capacity: the Czech Republic, Japan, and South Korea. Total decrease in these three countries was 242,000 tpy.
With no plant in the world announced a complete shutdown, the capacity decreases were due to partial shutdowns or companies restating ethylene production.
The most significant decline was in Japan. Idemitsu reports on its website that its Tokuyama plant has a capacity of 450,000 tpy, compared to 623,000 tpy as reported in last year’s survey.
In addition, plants in Australia, Netherlands, and the US decreased capacity; however, these decreases were offset by increases in other plants in the respective country.
Ownership, name changes
As previously mentioned, BP renamed its petrochemical business and sold it to Ineos. There were no other significant ownership or name changes in 2005.
Table 4 lists the top 10 owners of ethylene capacity worldwide. There were only two changes to this table in 2005; first is the appearance of Ineos.
BASF is in the list at tenth place due to the start-up of the BASF-YPC plant in China, of which it owns 50%. The move up knocked Nova Chemicals Corp. out of the table.
Construction
Last year, OGJ forecast that more that 6.8 million tpy of new capacity would come online in 2005, based on responses to construction surveys. Of this, nearly two-thirds actually started up.
The main shortfall was due to three major projects in Iran having their startup dates postponed. According to Steve Zinger, global business director, heavy olefins and elastomers for Chemical Market Associates Inc. (CMAI), Houston, the 1.1-million-tpy Marun Petrochemical Co. plant is currently near mechanical completion.
He also said that the 1-million-tpy Arya Sasol Polymer Co. plant, a joint venture of National Petrochemical Co. and Sasol Ltd., and the 1.32-million-tpy Jam Petrochemical plant were scheduled for mechanical completion and commissioning in July 2006.
According to the latest OGJ construction data, nearly 3.9 million tpy of new capacity are slated to come on stream in 2006 (Table 5).
The Marun plant is in Bandar Imam, Iran, and is part National Petrochemical Co.’s olefin No. 7 complex. The Jam and Arya Sasol steam crackers are both in Bandar Assaluyeh.
A large amount of capacity is scheduled for start-up in 2008. More than 13 million tpy of capacity in 14 projects is slated to come online. Seven of the projects list capacities of more than 1 million tpy each. Almost all are in the Middle East.
Fig. 2 shows the timing of ethylene capacity additions, according to Sergey Vasnetsov, a research analyst for Lehman Bros. The data in Fig. 2 may not agree with OGJ’s construction numbers because the figure includes incremental capacity creep.
According to Vasnetsov, ethylene capacity will grow 5.4% in 2006 and an additional 5.7% in 2007.
Global market
Ethylene markets continued to recover in 2005. Fig. 3 shows that worldwide operating rates were about 92%, a slight drop off from 2004, because capacity started catching up with demand. Operating rates were high in 2004 when incremental demand surpassed capacity increases.
Fig. 4 shows ethylene production by type of feedstock. According to CMAI, global ethylene production capacity will grow on average at 5.4%/year in 2005-10, up from 3.5%/year in 2000-05.
Ethane will be the most in-demand feedstock during 2005-10. Its demand growth will average of 7.1%/year in 2005-10, up from 3.2%/year in 2000-05.
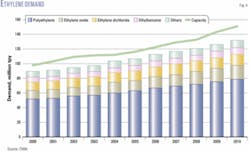
Fig. 5 shows the demand for ethylene by the type of derivative. According to CMAI, demand growth will average 4.3%/year in 2005-10. Most demand growth will occur for ethylene oxide, which will increase 5.4%/year in 2005-10, up from 3.7%/year in 2000-05. Polyethylene will have the next-highest average growth of 4.6%/year in 2005-10.
Fig. 6 shows that the Middle East producers will dominate the net equivalent ethylene trade in the future. All other regions will become net importers by 2009, according to CMAI.
US market
Fig. 7 shows that ethylene prices have increased steadily since 2002 for US producers. Vasnetsov expects prices to peak in 2006 and remain between 40-50¢/lb through 2007.
Fig. 7 also shows that ethylene cash margins have been much more volatile since 2001. They will remain so due to volatility in natural gas prices, the primary feedstock for US producers. ✦


