Study compares PVT calculation methods for nonblack oil fluids
A comparison of different methods for generating pressure-volume-temperature (PVT) properties of volatile oil and gas-condensate reservoir fluids determined that PVT properties generated with the Whitson and Torp method agree the best with full equation-of-state (EOS) compositional simulation.
Besides the comparison with the EOS compositional simulation, the study also compared the initial-oil-in-place (IOIP) calculations with the generalized material-balance equation.
The study included a wide range of fluid characteristics from nine reservoir fluid systems: six gas condensate, two volatile oil, and one wet gas.
Material balance
Material-balance calculations are useful for analyzing reservoir performance, estimating oil and gas reserves, and predicting future reservoir performance.
Schilthuis in 1936 was among the first to formulate and apply material-balance analysis.1 In time, the industry created more sophisticated material-balance models, each attempting to provide greater generality.
In 1963, Havlena and Odeh presented techniques for interpreting the material-balance equation as a straight line that facilitates graphical techniques.2
The two-hydrocarbon component or zero-dimensional material balance model still applies only to black oil or dry-gas reservoirs. As volatile oil and gas-condensate exploitation increases, the industry needs to change these limitations.
Walsh addressed this limitation and developed a generalized material-balance equation to treat the full spectrum of reservoir fluids.3-7 The key is the use of the volatile oil-gas ratio (Rv) expressed in units of stock-tank cubic meters/standard cubic meters or stock-tank barrels/standard cubic feet (stb/scf). This variable effectively describes the amount of volatilized oil in the reservoir gas phase.
Rv is a function of both reservoir-fluid composition and the separator configuration, which is typically designed for maximum liquid recovery.
A comparison among different methods of generating the modified black oil (MBO) PVT properties determined the accuracy of three models. PVT properties considered include the oil-formation volume factor (Bo), solution gas-oil ratio (Rs), gas-formation volume factor (Bg), and Rv.
The study determined the accuracy of the methods through a comparison of the MBO simulation with straight-line material-balance calculations, followed with a comparison of the generated MBO PVT properties to the results of the compositional simulation.
The methods investigated were the Whitson and Torp (W&T),8 Coats,9 and Walsh and Towler7 correlations. References 10-11 provide additional details on the calculations.
Fluid samples
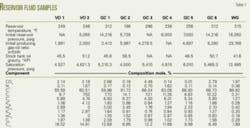
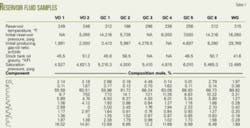
The study included nine reservoir-fluid samples: six gas condensates (GC), two volatile oils (VO), and one wet gas (WG).
This article gives detailed results for three of the samples, one from each fluid type. The samples are from reservoirs representing different locations and depth and cover a wide range of characteristics (Table 1).11
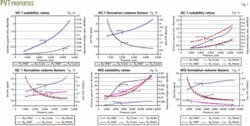
Figs. 1a-1b show the calculated MBO PVT properties (Rs and Rv) and (Bo, and Bg) with the W&T method for Sample VO 1. Both the Walsh and Coats methods apply only to gas-condensate fluids.
Figs. 1c-1f show the calculated MBO PVT properties (Rs, and Rv) and (Bo, and Bg) with W&T, Coats, and Walsh methods for samples GC 1 and WO. These figures indicate that the W&T and Coats methods produce identical results for Rs, Rv, and Bo with some differences at higher pressures only for Bg.
The Walsh method was poorest in each case. For Sample GC 1, only the Rv and Bg curves have values similar to those generated with the W&T and Coats methods. The Rs curve is overestimated and Bo is underestimated.
For sample WG, the Walsh method underestimates the Rv, and Bo and overestimated Bg, and Rs.
For calculating the W&T and Coats values, the study used the EOS modeling program PVTi12 after first matching PVT experiment results with the PR-EOS model.13
For the Walsh calculations, the study used a spreadsheet, as Walsh suggests in Reference 7, and found that this method provides inaccurate results because it is restricted to the pressure levels found in constant-volume depletion (CVD) experiments.
MBO PVT
Various authors have shown that MBO simulation is adequate for depletion studies of volatile oil and gas condensate fluids.8 9 14 15
Our study used a numerical simulation test problem to compare the different MBO PVT generation methods. Compositional simulation provided the basis for comparing MBO simulation results for different PVT generation methods.
The test case is a single-well, one-dimensional radial flow, with 20-md absolute permeability and 20% porosity. The simulation included 70 radial grid blocks and was run from the initial pressure to depletion without pressure maintenance.
The run assumed an initial 12% water saturation with the water remaining immobile throughout the simulation. Initial reservoir pressure was set higher than the saturation pressure of the fluid system being simulated.
Figs. 2a and 2b compare the MBO and compositional simulation results for Sample VO 1. The results indicate that the W&T method almost completely matches the compositional simulation results. The Coats and Walsh methods were not used for this volatile oil case because both apply only to gas-condensate calculations. The PVTi software does not produce Coats results for pressures below the bubblepoint, as McVay recommends.10
Figs. 2c and 2d compare MBO and compositional simulation results for sample GC 1. Fig. 10 shows that the W&T method matches closely with the compositional simulation results, while the Coats method provides poorer results.
The Coats method has more deviation in the pressure match once the pressure drops below the dewpoint. The match improves, however, with depletion.
For Figs. 2e and 2f, both the W&T and Coats methods match closely and reasonably well with the compositional simulation. The slight variation between compositional simulation and MBO results for GOR may be due to a slight difference in condensate production between the two models, which is exaggerated because daily gas production is high compared to condensate production.
For all practical purposes, the match is reasonable.
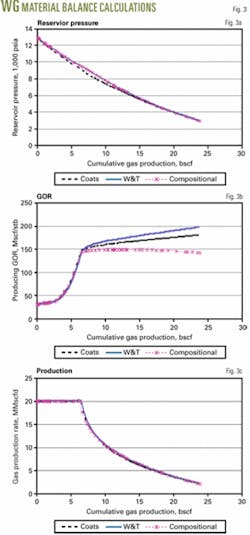
Figs. 3a-3c compare the MBO and compositional simulation for sample WG. The figures show that the W&T and Coats methods match well with results from the compositional simulation.
While Fig. 3d indicates that the W&T and Coats methods differ slightly with the compositional simulation results for the same reasons as presented previously.
The study did not include the Walsh method for the simulation cases because it provided poorer results. The Walsh method is based on a few pressure points from CVD experimental data.
The study used the same comparisons for the other fluid samples with similar results.11
Material-balance comparisons
The study used a general spreadsheet to compare W&T, Coats, and Walsh PVT methods with the generalized material-balance calculation (GMBC).4 5
The general form of the material-balance equation, Equation 1 (see equation box) for oil reservoirs and Equation 2 for gas reservoirs, is a straight-line equation for initially undersaturated, volumetric reservoirs when the calculations neglect formation and water compressibility.
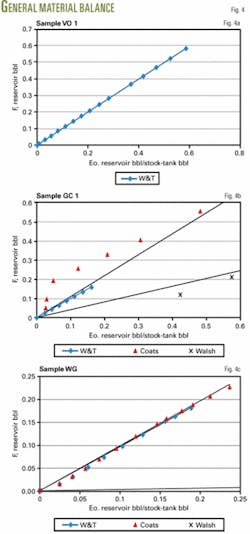
The compositional simulation test case used initial oil in place (IOIP) of 1 billion stb, while the W&T, Coats, and Walsh PVT generation methods provided the required PVT data, except for the volatile oil where only the W&T method generated the PVT data.
The best-fit lines and their slopes were computed with the least squares methods and the slopes of the lines yielded the IOIP.
Fig. 4a shows the GMBC results as a straight line with the W&T method for Sample VO 1. The line fits the calculated points well and its slope is 0.9935, or a 0.65% error in IOIP.
The GMBC with the W&T, Coats, and Walsh methods for GC 1 (Fig. 4b) indicates that the line fits well. The slope of the line is 0.9776, or a 2.24% error in IOIP.
For Coats, the straight line fits the calculated points with a slope of 1.0797 (7.79% error of IOIP). For the Walsh method, however, the line fits the calculated points poorly and has a 47.77% error.
Fig. 4c provides the results of the GMBC as a straight line for the W&T, Coats, and Walsh methods for the WG sample. The W&T (4.64% error) and Coats, (2.35% error) correlated well while the Walsh method has a poor correlation.
The same procedure was followed for the remaining six samples (Table 2) and the W&T methods provided the best results, although the Coats results are also acceptable. The Walsh method, however, produces high errors; possibly because it can only be calculated at pressures reported for a CVD experiment.
Both W&T and Coats methods generate PVT properties at many pressure steps because the models were based on EOS models.
The Coats method shows higher errors for near critical fluids.
The study concluded that the use of MBO PVT properties is adequate for modeling depletion in volatile oil and gas condensate reservoirs, and the generalized material-balance equation provides an easy and accurate way for calculating original fluid in place for all fluid types. ✦
References
1. Schilthuis, R.J., “Active Oil and Reservoir Energy,” AIME Transactions, 1936, pp. 33-52.
2. Havlena, D., and Odeh, A.H., “The Material Balance as an Equation of a straight line,” JPT, August 1963. pp. 896-900.
3. Walsh, M.P., “A Generalized Approach to Reservoir Material Balance Calculations,” Journal of Canadian Petroleum Technology, Vol. 34, No. 1, 1995, p. 55.
4. Walsh, M.P., Ansah, J., and Raghavan, R., “ The New Generalized Material Balance As an equation of a Straight-Line: Part 1-Application to Undersaturated and Volumetric Reservoir,” Paper No. SPE 27684, SPE Permian Basin Oil and Gas Recovery Conference, Midland, Mar. 16-18, 1994.
5. Walsh, M.P., Ansah, J., and Raghavan, R.: “The New Generalized Material Balance As an equation of a Straight -Line: Part 2-Application to Saturated and Non-Volumetric Reservoir,” Paper No. SPE 27728, SPE Permian Basin Oil and Gas Recovery Conference, Midland, Mar. 16-18, 1994.
6. Walsh, M.P., “New, Improved equation solves for volatile oil and condensate reservoirs” OGJ, Aug. 22, 1994, pp. 72-76.
7. Walsh, M.P., and Towler, B.F., “Method computes PVT properties for gas condensate,” OGJ, July 31, 1994, pp. 83-86.
8. Whitson, C.H., and Trop, S.B., “Evaluating Constant-Volume Depletion Data,” SPE Paper No. SPE 10067, JPT, March 1983, pp. 610-20.
9. Coats, K.H., “Simulation of Gas Condensate Reservoir Performance,” Paper No. SPE 10512, JPT, October 1985, pp. 1870-86.
10. McVay, D.A., Generation of PVT Properties For Modified Black-Oil Simulation of Volatile Oil and Gas Condensate Reservoirs, PhD Thesis, Texas A&M University, 1994.
11. El-Fattah, A.K., Volatile Oil and Gas Condensate Fluid Behavior for Material Balance Calculations and Reservoir Simulation., PhD Thesis, Cairo University, 2005.
12. ECLIPSE Program, Schlumberger Inc.
13. Peng, D.Y., and Robinson, D.B., “A New Two-Constant Equation of State,” Ind. and Eng. Chem. Fund., Vol. 15, 1976, p. 59.
14. El-Banbi, A.H., et al. “Producing Rich-Gas-Condensate Reservoirs-Case History and Comparison between Compositional and Modified Black-Oil Approaches,” Paper No. SPE 58988, SPE Fourth International Petroleum Conference and Exhibition, Villahermosa, Mexico, Feb. 1-3, 2000.
15. Fevang, O., Singh, K., and Whitson, C.H.: “Guidelines for Choosing Compositional and Black-Oil Models for Volatile Oil and Gas-Condensate Reservoirs,” Paper No. SPE 63087, SPE ATCE, Dallas, Oct. 1-4, 2000.
The authors
K.A. El-Fattah is assistant professor in the mining, petroleum, and metallurgical department, faculty of engineering, Cairo University. He also is a consultant engineer in reservoir simulation, and directional and horizontal drilling. El-Fattah holds a BSc, an MSc, and a PhD in petroleum engineering from Cairo University. He is member of SPE.
Ahmed El-Banbi is a data and consulting services manager for Schlumberger Inc. in Oman. He previously was a professor at Cairo University. El-Banbi holds a BS and an MS in petroleum engineering from Cairo University and an MS and PhD in petroleum engineering from Texas A&M University.
M.H. Sayyouh is the chairman of the mining, petroleum, and metallurgical department, faculty of engineering, Cairo University. He also is a consultant engineer in reservoir simulation and enhanced oil recovery. Sayyouh holds a BSc and an MSc in petroleum engineering from Cairo University and PhD in petroleum and natural gas engineering from Pennsylvania State University. He is a member of SPE.
