A study has found that the choice of the optimum compressor interstage pressure is an economic decision that can be estimated by equal compression ratios for each stage and adjustments to minimize total power requirements
The study involved:
• Rigorous process simulation for determining the optimum interstage pressure for a two-stage compressor.
• A sensitivity study to simulate the gas compression process. Investigated were the effects of interstage pressure variation, presence of water vapor in the feed gas, effect of feed-gas temperature, and impact of heavy ends in the feed gas.
• Creation of an optimized gas compression strategy through the use of commercial simulation software and the Soave Redlich-Kowng1 (SRK) equation of state (EOS) for prediction of phase behavior and thermodynamic properties.
The study simulated a natural gas compression process for gas-injection enhanced oil recovery (EOR) with known feed-gas conditions, pressure, temperature, composition, flow rate, and target pressure.
Determined from the study were the optimum interstage pressure, actual total power required, cooling load required, and the discharge temperature.
Power calculations
Theoretical power requirements are independent of compressor type, while the actual power requirements vary with the compressor efficiency.
In general, designers use Equation 1 (see equation box) or the simpler Equation 2 for determining the power requirements. In the equations:
• η - Efficiency.
• m• - Mass flow rate.
• h - Specific enthalpy.
• P1 - Suction pressure.
• P2 - Discharge pressure.
• T1 - Suction temperature
• q - Gas flow rate at standard
condition, Ps and Ts.
• Za - average gas compressibility
factor.
• k - Heat capacity ratio.
These two equations are equally correct theoretically. The practical choice of equations depends on available data, although it is somewhat arbitrary.
A designer should make the power calculation per stage of compression and then sum the power requirements for all stages connected to a single driver. For general planning purposes, graphical solutions shown in Reference 2 can provide results comparable to these equations.
From a calculation viewpoint alone, the power calculation is sensitive to the flow rate, inlet temperature and pressure, and outlet pressure. Gas composition is important but a small error in it is less important, provided that corrosive components are not excluded. A compressor will operate under varying values for the variables affecting its performance. Thus the most difficult part of a compressor calculation is the specifying of a reasonable range for each variable and not the calculation itself.
Maddox3 emphasized that a single value for each variable is not the correct way to evaluate a compression system.
Normally, a designer uses the thermodynamic calculations for an ideal (reversible) process and then uses an efficiency factor to adjust the calculated results to real world conditions.
The compression process has three ideal processes: an isothermal process, an isentropic process, and a polytropic process.
Any of these processes form a suitable basis for evaluating compression power requirements with either hand or computer calculations. The isothermal process, however, is seldom used as a basis because normal industrial compression is not a constant temperature process. Practical limitations often place the compression ratio in the range between 2 and 6. But the choice of the interstage pressure is an economic decision that can be estimated with equal compression ratios for each section and then adjusted to minimize total power requirements.
EOS
The equation of state (EOS) is central to any commercial process-flow simulation software. Software normally includes a cubic EOS such as Soave Redlich-Kowng (SRK)1 or the Peng-Robinson4 EOS because both are simplistic and relatively accurate.
With proper binary interaction coefficients, these two equations provide practically the same results. This study, therefore, only uses the SRK EOS.
Computer solution
For a known gas rate, pressure (P1), temperature (T1), and composition at the inlet condition and discharge pressure (P2), the calculation with a computer of the compressor power requirements based on an EOS involves the following two steps:
1. Determine the ideal or isentropic (reversible and adiabatic) enthalpy change of the compression process. Multiplying mass rate by the isentropic enthalpy change yields the ideal work requirement
2. Adjust the ideal work requirement for compressor efficiency.
The steps include:
• Assume steady state such that m•1 = m•2 = m• and that the feed composition remains unchanged.
• Calculate with the EOS the enthalpy H1 = f(P1, T1, and composition) and entropy S1 = f(P1, T1, and composition) at the suction condition. For the isentropic process S2*(P2, T2*, composition) = S1(P1, T1, composition).
• Calculate the ideal enthalpy (H2*) at the outlet condition for the known composition, P2 and S2*.
• Calculate the ideal work W* = (m•)(H2*-H1).
• Calculate the actual work, which is the ideal work divided by efficiency or W = W*/η.
• Calculate the actual enthalpy at the outlet condition with H2 = (W/m•) + H1.
The EOS for the known H2, P2, and composition calculates the actual outlet temperature. Compressor efficiency, and hence, the compression process depends on the method used to evaluate the work requirement.
The isentropic efficiency is in the range of 0.70-0.90, and this study uses a 0.72 isentropic efficiency.
Case study parameters
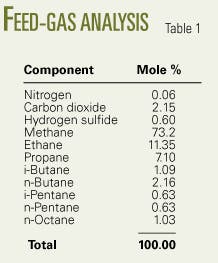
Table 1 shows the gas mixture composition at 37° C. (98.6° F.) and 31 barg (450 psig) on a dry basis used for the study. The study assumes that gas is compressed in two stages for injection into an enhanced oil recovery project. In the process, the gas-injection compression unit (Fig. 1) has a 131 barg injection pressure and a 65° C. temperature, and the flow rate of Stream 2 is 6.792 million cu m/day (240 MMscfd).
The calculations assume a 72% isentropic efficiency and an 80% mechanical efficiency for each compression stage. Each compressor stage has a 56° C. inlet temperature limit that should not be exceeded.
The feed gas is saturated with water and the allowed pressure drop between each compressor discharge and exit of the flash separator is 5 psi (34 kPa).
Phase envelope
The first step in the calculations determines the state of the inlet to the first-stage suction scrubber.
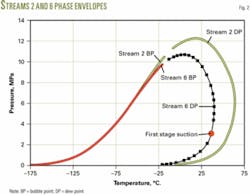
Fig. 2 shows the phase envelope for the feed gas saturated with water (Stream 2). Also the figure presents the phase envelope for Stream 6, which is the vapor stream at the first-stage suction. The red circle is the condition at the first-stage suction.
Optimization scenarios
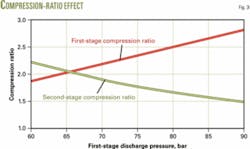
Fig. 3 presents the variation of compression ratios as a function of the first-stage discharge pressure. This figure indicates that the stages have equal compression ratios of 2.04 at a 65.2 bar (6,520 kPa) pressure. The ideal optimum interstage pressure for the equal compression ratio may also be calculated with [(132)(32)]1/2 + (0.34/2) = 65.2 bar.
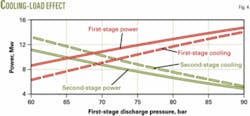
Fig. 4 shows the variation of each heat exchanger cooling load and compression power requirement for each stage as a function of first-stage discharge pressure. These variations are almost linear.
Table 2 lists the simulation results for two cases. In Case A, the total power requirements were minimized by finding the first stage’s discharge pressure with the constraint of equal stage compression ratio. This results in about equal compression power requirements for the two stages.
It should be noted that the slight difference in compression ratio and stage compression power is due to the 34 kPa (5 psi) pressure drop between the first-stage discharge and second-stage suction.
In Case B, however, the total power requirement was minimized by finding the first-stage discharge pressure without the constraint of equal stage compression ratios.
Table 2 summarizes the results, which indicate a large difference in the first-stage discharge pressures between Case A and B.
Also seen is that W1 for Case B is 27% larger than for Case A but W2 of Case B is 28.5% lower than that of Case A. total power requirement (W1 + W2) for Case B is lower than Case A, about 0.8% smaller.
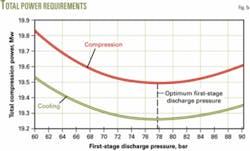
Fig. 5 shows the variation of total compression power and total cooling load requirement as a function of first-stage discharge pressure. This figure clearly shows that the minimum power requirement occurs when the first-stage discharge pressure is 77.8 bars. Also it indicates that the total power requirement changes little for first-stage discharge pressures between 76 and 80 bars.
Water vapor in feed
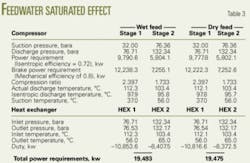
Table 3 shows the simulation results based on an unequal compression ratios for the two options of wet feed (saturated with water vapor) and dry feed. As seen in this table, water vapor has little effect on the performance of the process. The 0.23% increased compression power requirement for the wet feed is due to a 0.28% increase in feed flow rate because of the presence of water. It should be noted that the dry-feed flow rate is 11.953 kmol/hr and the wet-feed flow rate is 11,987 kmol/hr (34 kmol water/hr + 11,953 kmol of dry gas/hr).
Heavy ends in feed
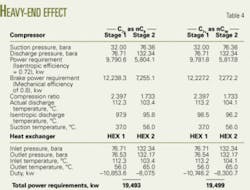
The replacement of normal octane (nC8H18) to normal decane (nC10H22) allowed the simulation to note the effect of heavy ends.
Table 4 shows the simulation results based on unequal compression ratio for these two heavy ends. As seen, the total compression power requirements decrease slightly for the nC10H22 case because the first separator removes more of the heavy components.
The presence of heavier components in the feed stream does not affect the compressor power of the stages and heat exchanger. In other words, the feed flow rate to the compressor decreased when nC10H22 replaced nC8H18.
Feed temperature
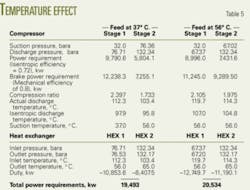
To study the effect of feed temperature on the process, the simulation increased the feed temperature to 56° C. from 37° C. (Table 5).
The feed at 56° C. represents the actual condition during the summer. As seen from this table, the warmer feed requires an increase of 5.34% in total compression power consumption. The feed temperature, therefore, is an important parameter especially during seasonal changes.
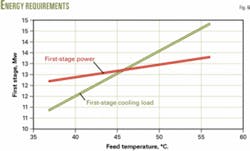
Fig. 6 shows the variation of energy requirement with feed temperature for the unequal compression ratio case with compression ratios of 2.397 and 1.733 for Stages 1 and 2, respectively.
Stage 2 was not affected with the variation of feed temperature; therefore, the compression power and cooling load for Stage 2 remained constant at 7.254 Mw and 8.407 Mw, respectively. Because the compression ratio was constant, the compression power requirement for Stage 1 varied from 12.2 to 13.28 Mw; however, the cooling load varied greatly from 10.85 to 14.83 Mw.
Tips
In the light of preceding discussion, the following tips are suggested:
• Check the compressor’s suction stream phase. This also includes the interstage condition to ensure that liquid does not enter the compressor.
• If economically possible, lower the interstage suction temperature because this will reduce the overall compression power requirement.
• Check the water content at the interstage conditions because water may have dropped out. The water would affect equipment performance.
• The choice of equal pressure ratios for minimizing the compression power requirement is close to an optimum choice when suction temperatures are equal.
• Characterization of the heavy ends (C7+) does not greatly affect the compressor power requirement because heavy components are mostly removed in the inlet scrubber.
• Characterization of C7+ components will affect the condensation that takes place in the inlet suction scrubber, and thus affect the molecular weight of the compressed gas.
• The optimum interstage pressure does have to have an equal compression ratio. ✦
References
1. Soave, G., “Equilibrium Constants from a Modified Redlich-Kwong Equation of State,” Chemical Engineering Science, Vol. 27, No. 1197, 1972.
2. Campbell, J.M., Gas Conditioning and Processing, Volume 2, the Equipment Modules, 8th Edition, Campbell Petroleum Series, Norman, Okla., 2001.
3. Maddox, R.N., and Lilly, L.L., Gas conditioning and processing, Volume 3: Advanced Techniques and Applications, John M. Campbell and Co., Second Edition, Norman, Okla., 1990.
4. Peng, Y.D., and Robinson, D.B., “A New Two-Constant Equation of State,” Industrial & Engineering Chemistry Fundamentals, Vol. 15, No. 59, 1976.
The authors
Mahmood Moshfeghian ([email protected]) is a consultant and instructor at John M. Campbell & Co., Norman, Okla. He is on leave as a professor of chemical engineering at Shiraz University, Iran, where he served as department head and associate dean of research in the college of engineering. Moshfeghian was previously a professor of chemical engineering at the University of Qatar and a senior research scientist at the Kuwait Institute for Scientific Research. He holds a BS, an MS, and a PhD in chemical engineering from Oklahoma State University, Stillwater.
Frank Jarrett teaches gas processing courses for the John M. Campbell Co. and is a senior process engineer for Washington Group International, Denver. He has more than 30 years of experience in the natural gas processing industry. Jarrett has a BS in chemical and petroleum refining engineering from the Colorado School of Mines and is a registered professional engineer in Colorado.
Hasan M. Qabazard is director of the petroleum research studies center at the Kuwait Institute for Scientific Research, Ahmadi, Kuwait. He previously worked as a process engineer and project manager for several companies. Qabazard has a BSc in chemical engineering from the University of Tennessee, Knoxville, and an MSc and PhD in chemical engineering, from Oklahoma State University, Stillwater.


