The Fall 2004 Clarkson report on the world's shipping industry hit desks in January 2005.
The report's perspective is September 2004. Some events since then clearly affect the report's commentary and conclusions. Nevertheless, as the only publicly available overview of world shipping, the report's analysis can be useful.
Major elements of this analysis focus on the world's economy as a backdrop to events among the world's shipping fleets, the skyrocketing rates for very large crude carriers (VLCCs), and the rapid expansion of the world's LNG fleet.
Tale of two economies
The report notes that Asian economies, not just China but all of Asia, grew in the 6 months leading up to September 2004 by around 11%. At the same time, Atlantic economies grew more slowly but still at a "very respectable" 3%.
Shipping's fortunes, therefore, were being driven by the "best economic scenario" in 2 decades. At that point in 2004, says the report, sea trade seemed set to grow by 4.8% for the year. Trade in 2005 will grow by 3.3%.
The Clarkson report notes that economic concerns focused in late 2004 on the two largest economies of the world, the US and China, "both of which have structural problems that could bring about a downturn in ship demand."
For China, the problem is the "volatility of infrastructure development." Chinese steel production will have increased to 249 million tonnes in 2005 from 127 million tonnes in 2000, "adding capacity equal to the production of Japan. This surge will probably be followed by consolidation, or even a decline."
The Chinese government, as was widely reported in late 2004, had been trying to slow the economy gently, but opinions differed on whether this was achievable.
The Clarkson report says there were also problems in the banking sector, and of course "manufacturing depends on the health of overseas markets."
There is, therefore, a significant risk that the 15.9%/year industrial growth reported by China could be much lower this year, says the analysis.
In late 2004, India, Taiwan, Thailand, Malaysia, and Japan were all reporting rapid industrial growth rates. Japanese industry grew at 5.9%/year to July 2004, and Thailand, Taiwan, and Malaysia reported growth rates of more than 9%/year. India was growing at 7.9% and South Korea a robust 12.8%/year to July 2004.
"This is very positive," says the report, but this growth is "very closely linked to China, which has become a major export market for these countries."
In the Atlantic, says the Clarkson report, Europe was very sluggish 2002-03. Industrial growth statistics for Europe showed that, after declining by 0.6% in 2002, industrial output by July 2004 edged up to 1%/year. Euro area's gross domestic product (GDP) growth was on track to be about 2% in 2004 and about the same this year.
The US record rate of growth, on the other hand, was much more encouraging. Despite worries about job losses, industrial output grew by 5.2% through August 2004. The Clarkson report notes, however, that many economists were concerned over the growing imbalances in the US economy. "The budget deficit, mounting balance of payments deficit, and a diminishing consumer savings rate, boosted by a housing bubble and heavy withdrawal of equity from the housing market" produced positive growth, "but this may prove untenable."
Forecasts in September 2004 suggested the US GDP would grow by 3.4% in 2005, compared with 3.9% in 2004. The report cautions, however, that "this could easily conceal a rapid slowdown during the year."
Shipbuilding
Over the 6 months before September 2004, money "poured into shipping," forcing a scramble for berths that allowed shipyards to drive up prices and book capacity "as far ahead as they daredU ."
Clarkson expects deliveries to reach 65.6 million dwt this year, up from 61.6 million dwt in 2004; shipyard output "will have doubled in 7 years."
Although new ordering was brisk up to September 2004, it was running about 15% behind levels in 2003. At that point in 2004, the very large amount of new shipping capacity on order suggested orders placed for all of 2004 might reach 100 million dwt.
If that happens, says the report, orders for 217 million dwt, representing 26% of the fleet, will have been placed in only 2 years.
Topping the bill for new orders stands the LNG market. Orders for 41 new vessels represented a 300% increase over 2003. LPG vessel ordering was not far behind with 100% increase, "admittedly from a pretty low base," says the report.
Shipbuilding prices increased by 18% through the first 3 quarters of 2004, with rumors of one VLCC being signed up at $100 million. Despite the pressure, shipyard prices in 2004 were no higher, says the report, than 10 years ago when the newbuild price for a VLCC reached $102 million, compared with $92 million today.
"This is a little surprising, considering that in those days VLCC rates only touched $40,000/day" for 2 months, and $25,000/day "was considered excellent," says the Clarkson report. In October 2004, VLCCs were earning $100,000/day.
Tanker market outlook
Over the 6 months covered by the report, the tanker market "has again proved its resilience."
Tanker demand grew rapidly in 2003-04. In 2003, crude exports increased by 8.4%, with 17.3% growth from the long-haul exporters and 4.6% from short haul. Prospects in late 2004 indicated that exports in 2004 would grow by about 8.6%, says the report. "It is not unusual to get such rapid growth in a single year," but 2 years in a row is "exceptional."
Asia was leading the growth with imports, projected to grow by 7.8% in 2004, following a decline in 2001-02.
The main driving force, not surprisingly, was China. Through mid 2004, the report notes, "it was widely believed that Chinese crude imports would remain relatively subdued," but in the 12 months through August 2004, they approached 3 million b/d.
At mid 2004, Paris-based International Energy Agency was predicting that Chinese oil demand would increase by 800,000 b/d during 2004, driven partly by the growth of car ownership and partly by problems in power generation. Blackouts had resulted in industrial companies using standby generators, which burn oil, and there may have been some stockbuilding, says the report. Most of the extra oil would come in by sea.
India's imports also jumped by 300,000 b/d at mid 2004, although the relatively short distance from the Persian Gulf diminished its impact on tanker demand.
For 2005, IEA was predicting 1.7 million b/d growth in world oil demand, which would increase tanker demand by around 10-12 million dwt (3.5%), give or take "any tonne-mile effect."
Uncertainty over the business cycle and China, says the report, makes it difficult to attach much significance to these forecasts. "Oil-price volatility is a looming threat and has unseated the tanker market" three times in the past 30 years.
Tanker supply
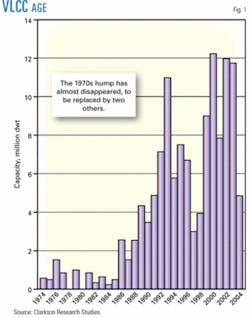
Against this background, the supply outlook for 2005, says the report, is "tricky to weigh up." Fig. 1 shows a profile of VLCC tanker age.
At Sept. 1, 2004, the tanker fleet was at 316.4 million dwt, with an order book of 87.2 million dwt, representing 27.6% of the fleet. After taking account of scrapping, Clarkson estimates the tanker fleet will grow by 4.7% in 2005. With expected delivery of more than 30 million dwt of new tankers, this growth figure depends heavily on the phaseout of Category 1 single-hull tankers, says the report.
At September 2004, the VLCC fleet consisted of 444 vessels of 128.9 million dwt, showing that the fleet had grown by only 2 million dwt since the previous spring, "largely due to heavy scrapping in May and June."
As 2004 moved into its fourth quarter, the VLCC orderbook stood at 90 vessels of 27.5 million dwt, accounting for 21.3% of the fleet. Of this total, 10.1 million dwt was scheduled for delivery in 2005.
With 4.3 million dwt of Category 1 VLCCs to be scrapped, growth would hit about 6 million dwt by yearend 2005. The report shows Clarkson's estimate that the VLCC fleet will grow by 4.6% this year, well up from the 2.7% growth in 2004. "This is a tough target, but not an impossible one," says the report.
At Sept. 1, 2004, Clarkson found the Suezmax fleet consisted of 306 vessels of 45.5 million dwt with an orderbook of 13.2 million dwt, representing 29% of the fleet.
"The Suezmax fleet growth scenario is very similar to that of VLCCs," says the report. For 2004, the fleet was poised to grow by 2.5%, "as a result of moderate deliveries and fairly brisk scrapping." Clarkson estimates that the growth rates would "more than double to 5.4% in 2005, based on 4 million dwt deliveries, less 1.3 million dwt scrapping of Category 1 tankers. Once again, a stiff challenge but not impossible."
For the world's Aframax fleet at Sept. 1, 2004, the fleet stood at 618 vessels consisting of 61.4 million dwt and an orderbook of 17.8 million dwt, representing 29% of the fleet.
This is "similar to the Suezmax position, but with many more Category 1 tankers," says the report. "Our estimate is [for] 4 million dwt, though this is a murky sector and we have not been able to identify individual ships," the report says.
Clarkson's estimate is that the growth rate will accelerate to 4.9% in 2005, from 3.1% in 2004," making the Aframax sector just as vulnerable on the supply side as the larger sizes."
Market outlook; VLCCs
As the Clarkson report went to press in late 2004, the tanker market was "in the middle of one of those interesting spikes, with VLCC rates hitting a 30-year high. This proves that the market is tight and able to capitalize on the considerable uncertainty in the oil market."
(For an update on VLCC tanker rates covering late 2004 and early 2005, see next week's Transportation section.)
Clarkson expects demand to grow by around 3.5% in 2005 and supply by around 4.7%, "so [that] the balance will slacken somewhat.
"Though the world is vulnerable to recession, China's requirements seem to be driven by possibly recession-proof factors, notably logistics and surging car demand."
Although the 6 months leading up to Sept. 1, 2004, saw tanker rates slip back from the record highs reached at the beginning of 2004, Clarkson says the market nevertheless remains strongly positive: "A combination of robust demand figures and increasing supply concernsUprovided the conditions for rates to remain at historically high levels."
At Sept. 1, the world's tanker fleet consisted of 3,698 vessels offering 316.4 million dwt for carrying of wet cargo. For the first 9 months of 2004, owners took delivery of 219 tankers while scrapping only 86 vessels, "resulting in a 3.6% increase in total tonnage since December 2003."
Orders "remained buoyant," with a further 347 vessels contracted for delivery (against a total of 563 for all of 2003). The Clarkson report says, "This continuing optimism from ownersU pushed the order bookUto new heights,Ua total of 1,023 vessels (87.2 million deadweight)."
At the beginning for fourth-quarter 2004, tentative signs were emerging of a "buoyant winter, with exceptionally strong VLCC fixing heading into October and solid demand for heating oil.
"This, combined with still tight inventories, the continuing China effect and continuing (albeit calmer) demand growth for 2005 should carry the tanker market through to next spring with ease."
For VLCCs in 2004, it was the year when "VLCC owners simply [could] not lose, buoyed by increased production in the [Persian] Gulf and strong demand on long-haul routes.
"Spot ratesUfluctuated between $50,000 and $80,000/ day since January and timecharter rates continue[d] to move ever upwards. Spot earnings for a 1990s-built vesselUaveraged $54,219/day during 2004, with a post-spring peak at $75,460/day in July when OPEC confirmed that it would raise quotas to 26 million b/d over the summer.
"Since then the seasonal drop off in trade has pulled the market slightly downwards, and rates began September at $51,785/day," says the report.
VLCC prices continued to rise throughout 2004 "driven by a buoyant market and strong investor confidence." Newbuild prices at the beginning of fourth-quarter 2004 stood at $93 million, 20% higher than at yearend 2003 and "no doubt buoyed by a 20% expansion in the orderbook since January."
The secondhand VLCC market was even stronger over the 8 months leading into September 2004, with an "annualized 179% increase in transactions.
"A 5-year-old used vessel [at September 2004 achieved] around $91 million (an increase over a quarter since the beginning of 2004), indicating the desire of owners to place tonnage into the market as quickly as possible to take advantage of its strength."
Scheduled for delivery last year were 28 VLCCs (8.5 million dwt), says the report, a 26% decrease from 2003. Most of the vessels (16) had already been received by their owners. "A slight uptick [was] anticipated in 2005, with a further 33 (10.1 million dwt) slated for launch."
The report calls attention to "the almost complete lack of demolition activity," a "key indicator of the continued strength of the tanker market." At September 2004, only three vessels had been sold for scrap since the beginning of the year, "with no transactions recorded at all since June. This lack of available tonnage has helped demolition prices to remain at exorbitantly high levels."
This lack of demolition was also been one of the main reasons for the continuing growth of the VLCC fleet. At Sept. 1, 2004, a total of 128.9 million dwt was trading, which was "expected to reach 129.5 million dwt" by year- end 2004.
Clarkson's estimates, however, suggest that about 5.6 million dwt of VLCC tonnage "will need to be removed from the fleet before Apr. 5, 2005, to meet the IMO regulations on non-double hulled tankers. Owners may be holding back on scrapping to squeeze all possible profit from the vessels."
Continuing high production levels, particularly in the Persian Gulf, says the report, were likely to underpin the VLCC market heading into winter 2004-05, not least because the gulf appears "the only area with significant spare capacity."
Gas carriers
The year 2004 was a period of recovery for the gas freight market, says the Clarkson report, "albeit from a fairly low base for some sectors, with spot and timecharter rates edging upwards across all the size sectors of the fleet.
"The driving forces were the slowing of vessel supply growth (due to the contraction of the orderbook and further removal of vessels for scrap) and expansion of seaborne trade."
As expected, the LPG trade continued to grow in 2004 with more exports from the Persian Gulf. "In addition there were newly expanding supply sources from producers in the Atlantic Basin."
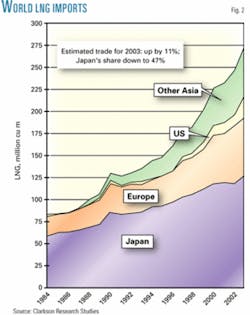
All parts of the LNG industry continued to show remarkable growth in 2004 and were expected to continue in 2005. An estimated 12.5 million tonnes/year (tpy) of new production capacity was scheduled to come on stream in 2005. Fig. 2 puts growth in LNG movements into a 20-year perspective.
Despite worries in the market over whether the necessary regasification for this capacity would be built, "recent developments indicate[d] that there [was] little need for this concern as several terminals all over the world [were] making good progress."
The report also notes that several terminals in the world's largest gas market, North America, had received final approvals to start construction. "For a long time it has been very difficult to receive permission to go ahead for this market, but these U approvals give the feeling that this is easing, perhaps especially on the Canadian coast," it says.
The shipowners of the world were "keeping up with this expected growth and [had] stepped up the ordering pace."
At Sept. 1, 2004, the order book stood at 11.5 million cu m, representing nearly 60% of the fleet at that time. Moreover, says the report, of the order book at that time, which contained 82 vessels, half of those orders were placed during the first 8 months of 2004.
A combination of factors underpinned Clarkson's forecast of strong growth and all point in one direction: "more LNG will need to be transported over longer distances."
- A push from oil companies that "now find that not only is their money well spent on monetizing remote gas fields through LNG projects but also that they need to as more countries impose non-flaring policies."
- An increase in average distance per voyage as "the main source of supply is moving from Asia towards the Middle East and the main source of demand growth is moving from Asia towards Europe and the US."
- An increase in demand from the world's two largest LNG markets, the US and the UK (and from several small but quickly growing markets). "Both these countries have relied on their domestic gas fields for supply. These, however, are now becoming so depleted that the cost of producing from them quickly is becoming less competitive than LNG imports."
The Clarkson report says that these forces, "combined with the increased liquidity in LNG trading and LNG vessel chartering," continue to make this market an "expanding and exciting one for years to come."


