Use of matrices in computer-aided lean energy management
LEAN ENERGY MANAGEMENT—8
A concern we have heard repeatedly as the first seven parts of this lean energy management series have circulated through energy companies is, "We seem to have many but not all of the lean principles and processes you write about. What should we do next to close the loop?"
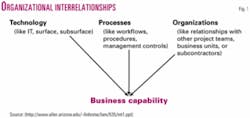
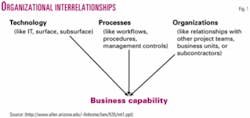
In this article, we describe an appropriately "lean" process to identify the business capabilities where lean principles will have the most value through a formal analysis methodology. This methodology is focused on how well technology, processes, and organizational interrelationships are being integrated in projects within a company (Fig. 1).
We call this migration to lean processes and tools "computer-aided lean management," or CALM, which sounds complicated. Instead, it all starts with rather simple matrices.
Matrices are powerful tools for evaluating the relationships between variables in the familiar form of rows versus columns (as in a spreadsheet).
Matrices are indeed simple on first look, but chain them together and the result is neural networks or rule-based expert systems. These, in turn, are superseded by even more advanced machine learning tools that force integrated connectivity and quantitative rigor.
They provide an effective methodology for defining how a company can migrate to lean energy management. Furthermore, they offer a solid path to the oil patch becoming an adaptive enterprise as real time data begin to stream into field control rooms all over the world.
Quality function deployment
One area of lean management that has developed extensive use of chained matrices for lean evaluation purposes is termed quality function deployment (QFD).
More information on QFD is available following the online version of this article (www.ogjonline.com).
QFD is widely used to develop implementation strategies for new or redesigned products. It forces the lean alignment of technology development with internal processes and customer needs. Obviously, getting the product right is a very risky enterprise, and thus evolves the need for lean rigor.
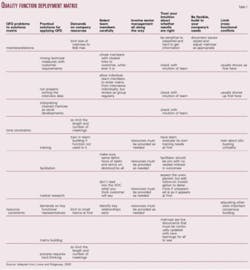
A QFD implementation matrix plots problems as rows against columns that provide solutions common to successful projects (Table 1). QFD drives the user to document and list everything.
In addition to chained matrices, the basic tools of QFD are the project roadmap and these documents and lists. A project roadmap defines the flow of data through a QFD project. Documents are required to record all background information for the project. Lists form the input rows and output columns of the matrices.
Examples of lists include user benefits, measures, basic expectations, functions, and alternative concepts. Lists generally have related data associated with them. For example, the priorities and perceived performance ratings resulting from market research can be associated with the list of benefits. Importance values are associated with measures and functions.
A matrix is simply a format for showing the relationship between two lists, and thus a matrix deploys, or transfers, the importance from the input list to the output list. For example, a common matrix relates "performance measures" to "user benefits."
Another matrix can then be created to relate "user benefits" to "product options." A chain of matrices has been created. An excellent animation of how a QFD product identification plan chains matrices together is available on line (http://www.gsm.mq.edu.au/ cmit/hoq/QFD%20Tutorial.swf).
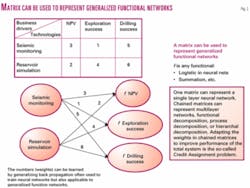
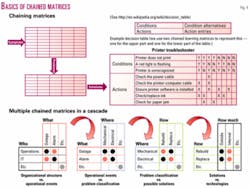
Matrices provide powerful tools for representing, mapping, and modeling lean principals in terms of existing organizational structures, processes, and expert knowledge comprising the business capabilities being studied. For example, rule-based expert systems, decision tables, and neural networks can be represented using matrices (Fig. 2).
The Pugh Matrix
In QFD matrices, indicators are associated with each measure and function. The indicators placed in each cell of the matrices can be as simple as a binary "yes" or "no" answer, or as quantitative as weights, probabilities, or confidence scores that are real numbers.
Often, an evaluation begins with binary indicators, which are then replaced with numbers to make the mapping a more accurate representation of the process being modeled. Even probabilistic or "fuzzy" processes can be represented with error estimates to incorporate an additional measure of uncertainty.
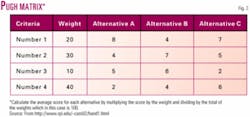
The "Pugh Matrix" is a part of Stuart Pugh's Total Design methodology, and it determines which potential solutions are more important or 'better' than others to solve any given problem (Fig. 3). The Pugh Matrix is used for concept selection in which options are assigned scores.
The Pugh Matrix contains evaluation criteria (rows), plotted against alternative product variations (columns), and a weighting of the importance of each criterion is placed into each cell. Scores from 1-10 for each alternative are then "weighted" for overall system importance to derive a total score.
The final design selection is made based on the highest consolidated score. The company is forced to consider many options so that it must choose the best among many. It can only be used after the voice of the customer (VOC) has already been captured, which in lean nomenclature means after product planning but before the design phase begins.
Chained matrices
A key to the use of matrices for lean evaluation is to systematically map processes within the business capabilities of an enterprise by chaining or cascading multiple matrices.
For example, chained matrices are a vehicle for mapping the complex cause-to-effect relationships from symptoms to problems and then from problems to solutions among technologies, processes, and organizational boundaries that compose the many levels of every project (Fig. 4).
Another example of chaining two matrices like this is the decision table from decision theory (top right in Fig. 4). The methodology of chained matrices is to make the vertical columns of the first matrix become the horizontal rows of the second, and so on through the series.
As explained in the next section, these chains can be formed in multiple directions, depending on the dimensional links. How the matrices are linked is guided by the QFD roadmap. As an example, a user can enter the decision table with a symptom, then define the most likely problem, and select among several solutions in the last of the chained matrices.
The House of Quality
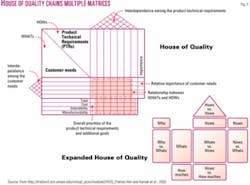
The House of Quality (HOQ), which has become synonymous with QFD, is a technique for chaining multiple matrices used in QFD product development or redesign to ensure that the customer's wants and needs are the basis for the improvement (top of Fig. 5).
HOQ is a highly structured approach that starts with customer surveys to establish the VOC and ends with detailed engineering solutions to design requirements based on the VOC.
The Expanded House of Quality (bottom of Fig. 5) chains even more matrices together, and depending on the complexity of the QFD project roadmap, the "rooms" of this expanded house will change. There are three common "blueprints" or templates, available for laying out HOQ rooms:
1.The American Supplier Institute Four Phase Approach of cascading houses.
2.The Expanded House of Quality of Fig. 5, bottom, developed by International TechneGroup Inc. (producers of QFD/Capture).
3.The Matrix of Matrices methodology developed by GOAL/QPC, which is likened to the modular design of homes (cf. King, 1989 and http:// www.GOAL/QPC.org).
These methods are included in QFD software such as QFD/Capture http:// www.qfdcapture.com & Qualica QFD and http://www.qualica.de
Roof of House of Quality
Like in many other industries, we have a general need to represent "common mode" interactions and failures.
In the HOQ, these are represented by a row (column) of a matrix that interacts in either a beneficial or antagonistic way with another parallel row (column).
These interactions sometimes occur in relatively few situations. If this is the case, then separate entries representing the synergy can be added to the matrix.
If, however, there are many interactions, then this approach becomes unwieldy and another approach must be used. Borrowing from neural network theory, a two-layer, chained matrix network can represent such interactions.
Thus the symptoms->problems matrix in Fig. 4 can be replaced with two matrices if there are common mode interactions amongst the systems. Likewise the problems->solutions matrix can be replaced with two matrices if there are interactions amongst the solutions.
The roof of the House of Quality is an example of this latter method of a matrix used to capture synergies and antagonisms of possible common mode failures that are at the end of the HOQ matrix chain (see the roof above the what's->how's matrix in Fig. 5). These relationships are symmetric, so only half a matrix is needed—the 60º triangle roof is used to represent this half matrix.
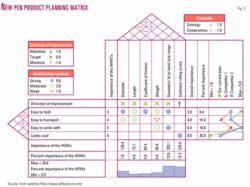
An example of the "main rooms" of the HOQ is given for the design of a new fountain pen product (Fig. 6). Note the roof of the House of Quality, where the plus sign represents synergy between two columns of the "How" matrix and the minus sign represents conflict between the diameter to weight tradeoff in those "How" columns. Also notice the side "roof" that captures the interactions of the "What" rows representing interactions among the customer needs.
Closing the feedback loop
A lean management system continually seeks perfection in performance. This aggressive learning of improvement (termed Kaizen by Toyota) requires feedback loops that are a key concept of lean.
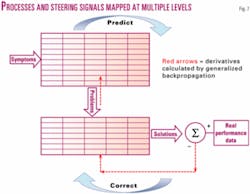
The goal of lean energy implementation is to reach Kaizen through rigorous enforcement of feedback loops that first predict outcomes and then make corrections based upon objective scoring of the predictions versus actual events (Fig. 7). Again, the lean process is solidly footed in theory.
Derivatives calculated by the chain rule of basic calculus are the source of the steering signals used for optimization via a generalized "back-propagation" learning method from, again, neural network theory, which allows the feedback loop to be closed.
CALM is the rigorous enforcement of the feedback loop using software to automatically track all operator actions, score outcomes of those actions, and back-propagate corrections of the numeric values in the matrices to the system performance model that optimizes performance from such feedback loops.
In our experiences with many lean implementations, most of the tools and methods of lean can be in place at energy companies, but this feedback loop is usually the one critical piece that is missing. Companies must implement an automated way to track actions, measure performance, and rigorously adjust the system to then improve performance. People alone are not enough.
The balanced scorecard is an example of a way many energy companies improve human performance, but it does not improve the linkage among human, machine, and computer models in the unified, integrated way required by lean energy management. In contrast, CALM uses ideas from stochastic control, option theory, and machine learning to build a software support system that forces the optimization of business and engineering objectives simultaneously under uncertainty.
Computer-aided lean management
In order to implement CALM for a project, a company needs:
- Identification of the business capability and enumeration of its objectives that define the required performance improvement.
- Road maps, chained matrices and simulation models of the processes and workflows comprising the desired business capability.
- Tracking of the actions that effect the processes of the business capability—an action tracker.
- Metrics that quantify the response of the system to those actions.
- Identification of the locations of flexibility in the system, and real options for improvement of the business capability utilizing that flexibility.
- Continuous reassessment of internal and external risks and uncertainties contributing to the business capability.
- An automated means of then generating steering signals at all levels of the operation to drive the system towards more and more positive objectives—the feedback loop required for machine learning.
The CALM principals are discussed in more detail below:
Identifying business capability
The organizational barriers and relationships must first be described, and technologies and processes used by both system components and people in the project mapped.
A model of the system
An axiom of control theory is, "to control a process, one first must understand the system well enough to model it"—either implicitly or explicitly.
Using the chained matrices approach, one can first map the processes involved in a business capability. Later, a higher fidelity computer model representing behavior of an airframe, or how electric power flows, or a fluid simulation of a reservoir, must be integrated with these more discrete models.
For an oil and gas field, both the aboveground "plant and facilities" model and the below ground "reservoir" model are necessary for CALM. They, in turn, must communicate with each other and give compatible results.
Action tracking
Untold loss of intellectual and real capital occurs because of the lack of the recording of all the actions affecting a process.
We have found that realizing this capability often is a major IT problem because it requires tracking actions from application to application and person to person across the software inventory and people workflow processes of the business capability.
One must build a database of these software and people interactions in order to track actions, as well as build an archive of the context of each action. They must then be "playable again" in a simulation mode so that incorrect actions can be analyzed, understood, and prevented from happening again.
Scoring responses to actions
CALM requires that metrics must be produced to score the response of the business capability to each action taken, so that the system can learn from and be optimized to better and better actions.
It is an amazing fact that in nonlean organizations such as those in our industry, bad actions are consistently repeated.
Flexibility and real options
This important step is at the core of the constant reevaluation of a business capability as lean organizations improve and adapt to a world of increasing volatility.
Since under a real option framework, there is value to adding flexibility under uncertainty, any system will be driven to maximize its locations of flexibility in lean implementation.
Several previous parts of this continuing series have dealt with the need for real options evaluation methodologies in the oil and gas industry.
Continuous reassessment of risk and uncertainty
Likewise, risks and uncertainties must be continuously reevaluated. We envisage that oil and gas fields of the future will remotely use live price and expense data streams, and their volatilities, to generate control signals via CALM to optimize performance automatically.
Automated steering signals to optimize performance
The generation of steering signals is the critical part of CALM that is often missing from organizations.
We have discussed one mechanism for generating such steering signals using the metrics thermostat (see Part 5 of this series). The metrics thermostat is a way of using implicit, rather than observable, explicit models for generating the steering signals.
A more robust and scalable approach is to map both the processes and steering signals at multiple levels using chained matrices based on the back-propagation algorithm from neural networks (Fig. 7). Werbos (1994) presents a method of generating steering signals in all kinds of business capabilities.
In general, these steering signals must anticipate and adapt to external and internal uncertainties and locations of flexibility within the business capability, simultaneously, which is a step beyond both the metrics thermostat and back-propagation.
Summary
We have shown how to chain matrices with techniques from machine learning to build an infrastructure to implement the rigorous feedback loops required to achieve the relentless improvement required for lean energy management.
Modern concepts from stochastic control theory, real option theory, and robotic control will come into more and more common use in our industry as CALM and the accompanying extensive use of feedback loops are established and the industry becomes more "real time."
Interestingly, these multiple, automated decision techniques use a common algorithm called "approximate dynamic programming"—also called reinforcement learning in the robotics and artificial intelligence communities.
This method provides a rigorous means for breaking down organizational silos because lean processes are enforced by software using a common algorithm engine.
The series
The Oil & Gas Journal lean energy management series is available to subscribers on line (www.ogjonline.com) and is published in the Nov. 22 and June 28, 2004, and Mar. 19, May 19, June 30, Aug. 25, and Nov. 24, 2003, issues.
Bibliography
Akao, Y., ed., "Quality Function Deployment: Integrating Customer Requirements into Product Design," Productivity Press, Cambridge, Mass., 1990.
Griffin, A., and Hauser, John R., "The Voice of the Customer," Marketing Science, Vol. 12, No. 1, Winter 1993, pp. 1-27.
Hales, R., Lyman, D., and Norman, R., "QFD and the Expanded House of Quality," Quality Digest, February 1994.
Hauser, J., and Clausing, Don, "The house of quality," Harvard Business Review, Vol. 32, No. 5, 1988, pp. 63-73.
Karsak, E.E., Sozer, S., and Alptekin, S.E., "Product planning in quality function deployment using a combined analytic network process and goal programming approach," Computers & Industrial Engineering, Vol. 44, 2002, pp. 171-190.
King, B., "Better Designs in Half the Time: Implementing Quality Function Deployment in America," GOAL/QPC, Methuen, Mass., 1989.
Lowe, A., and Ridgway, K., "UK user's guide to quality function deployment," Engineering Management Journal, Vol.10, No. 3, June 2000, pp. 147-155.
Pugh, S., "Total Design: Integrated Methods for Successful Product Engineering," Addison-Wesley, Wokingham, England, 1991.
Mazur, G., and Bolt, Andrew, "Jurassic QFD," transactions of the 11th Symposium on Quality Function Deployment, Novi, Mich., ISBN 1-889477-11-7, June 1999.
Pugh, S., "Creating Innovative Products Using Total Design: The Living Legacy of Stuart Pugh," Addison-Wesley, Reading, Mass., 1996.
Werbos, P.J., "Beyond Regression: New Tools for Prediction and Analysis in the Behavioral Sciences," Harvard University, 1974.
Werbos, P.J., "The Roots of Backpropagation: From Ordered Derivatives to Neural Networks and Political Forecasting," Wiley, 1994.
Werbos, P.J., "Generalization of backpropagation with application to a recurrent gas market model," Neural Networks, Vol. 1, 1988, pp. 339-365.
Werbos, P.J., "Maximizing Long-Term Gas Industry Profits in two Minutes Using Neural Network Methods," IEEE Trans. on Systems, Man, and Cybernetics, Vol. 19, No. 2, 1989, pp. 315-333.
The authors
Roger N. Anderson ([email protected]) is Doherty Senior Scholar at Lamont-Doherty Earth Observatory, Columbia University, Palisades, NY. He is also director of the Energy and the Environmental Research Center (EERC). His interests include marine geology, 4D seismic, borehole geophysics, portfolio management, real options, and lean management.
Albert Boulanger is senior computational scientist at the EERC at Lamont-Doherty. He has extensive experience in complex systems integration and expertise in providing intelligent reasoning components that interact with humans in large-scale systems. He integrates numerical, intelligent reasoning, human interface, and visualization components into seamless human-oriented systems.
