3D seismic data predict Al-Khafji reservoir attributes
A recent study using data from the Al-Khafji oil field, in the Arabian Gulf off Kuwait, shows how seismic attribute data can predict reservoir properties, such as porosity, and its lateral variations and extensions if the attributes are calibrated accurately with the respective petrophysical data.
The study explored reservoir quality and its spatial distribution and examined the stratigraphic trapping mechanism with 3D seismic imaging. The Al-Khafji field had available 350 sq km of 3D seismic and data from 62 wells.
In the study, the geological marker was flattened along a calibrated time horizon helped define a prospective regional Wara lithozone between Wara and Mauddud formations. The lithozone predominantly consists of shales, siltstones, and sandstones with minor calcareous sediments.
The study inferred a definite relationship between porosity and seismic attributes. Porosity estimation using seismic attributes at all seismic locations provided good confidence and the confidence improved at well locations, thus describing reservoir properties between and away from wells.
Porosity maps derived from well-calibrated seismic amplitudes and computed sand volume maps also predicted possible geological environments under which the sand bodies were deposited, particularly in the eastern part of the main Al-Khafji field.
In the eastern part of the area, the interpretation found a good confidence level for the associated porosity attributes and thereby opened up an additional exploration area for reserves additions and also for drillable exploratory or development locations.
3D seismic
The industry has proved that 3D seismic surveys are powerful tools for imaging subsurface geology. By reducing the dry-hole risk and providing better well placement to obtain greater flow rates and improved drainage, these surveys provide high cost-benefit ratios, improved reserves estimate, and shorter appraisal and project development times.
The surveys play a significant role in field development and production strategies and help rejuvenate oil fields with declining production profiles.
Integration of well data (more specifically, porosity, permeability, water saturation, facies, etc.), production data, seismic data, core data, and other supporting conceptual ideas will always add value to a prospect, field, or basin.
Mathematically integrating all these data is not easy because of scale differences and different acquisition sources. Any model generated with the available data can always contain uncertainty.
Geoscientists often create several possible geologic scenarios for their prospect. These scenarios involve looking past the most likely model, determining a different "what-if" scenario, and then capturing the differences mathematically or statistically. After this process, models can simulate the scenarios and determine the possible range of hydrocarbons contained in a prospect.
The creation of a series of equally probable reservoir models, each containing known and speculated information with their inherent uncertainties, is beneficial for understanding reservoirs. For a reservoir engineer, accurate determination of spatial porosity distribution is a key to understanding and predicting petroleum reservoir performance.
The characterization of the porosity distribution uses diverse information.
For example, well information provides good vertical resolution but poor horizontal resolution because of large distances between wells. On the other hand, seismic reflection data provide horizontal resolution but has lower vertical resolution.
In the study, seismic attributes computed from the 3D seismic data set proved useful in relating different reservoir characteristics interpreted from well data. These attributes input into models provided a description of the porosity distribution for Al-Khafji oil field.
The 3D seismic data were an asset in the study area for improving dense subsurface sampling of acoustic properties, which in turn can improve calibration of well reservoir porosity for the entire seismic coverage.
Literature review
Relating seismic attributes to petrophysical properties provides a way for spatial porosity distribution. An analyst can develop these porosity-seismic data relationships from theoretical and experimental sand and sand-clay models.
Traditionally, the work has involved velocity-porosity relationships estimated from regression methods that fit linear trends for certain intervals. More recently, the industry has used statistical techniques to obtain better results in relating porosity to seismic reflection attributes, particularly in describing inter-well porosity from surface seismic reflection data.
The accompanying box provides some references that present details on various aspects of this analysis.
Problem definition
Stratigraphic trapping mechanisms play a critical role for entrapping hydrocarbons in the Lower-Middle Cretaceous reservoirs in the Al-Khafji area. The acquired 3D seismic over the area aimed to delineate the stratigraphic and possible strati-structural traps and their associated reservoir setting.
The assessment of a reservoir's hydrocarbon potential requires the prediction of the porosity. As previously stated, it is difficult to solely predict lateral variations of porosity from sparse downhole measurements. The integration of 3D seismic with petrophysical data can improve the description of both lateral and vertical variations of porosity because the seismic has dense common depth-point (CDP) or common midpoint (CMP) coverage.
Prediction of reservoir qualities and spatial distribution are typical problems for planning exploration and development wells in the Al-Khafji area.
The present study includes unique input data and requirements, and each target area required its own unique workflow to solve the problem. The authors took advantage of integrating both high-resolution dense 3D seismic and the fairly dense well data of the Al-Khafji prospect.
The methodology employed in the study involves finding a correlation through cross plots between well-derived gross/average porosity and seismic attributes. The work established a calibration function from the correlated data and then further used it in a guided mapping technique to derive spatial porosity distribution of the Wara formation over the entire seismic grid.
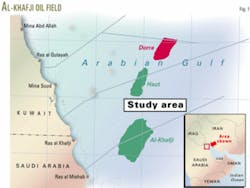
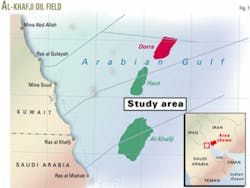
Fig. 1 shows the study area.
Al-Khafji geology
Al-Fares investigated the tectonics and stratigraphy of the Arabian Gulf basin and its relation to Arabian and African plate tectonics.1 He demonstrated the evolution of the petroleum systems in the Arabian Gulf with his geological arguments and use of available exploration data.
His study observed no significant structural style that had a direct bearing on hydrocarbon system in the Kuwait Gulf basin between the Burgan arch in the west and Khafji-Nowruz arch in the east. But regional geological cross-sections and seismic depth maps suggest structure dominance by regional gentle dip in the northeasterly direction.
The north-northeast trending Khafji-Nowruz arch, in the extreme east of the Kuwait Gulf, is a significant offshore structural feature. This structure plunges gently to the north-northeast and is asymmetric with a steeper western flank; and, in common with the Burgan arch, the upper part of the middle Cretaceous sequence appears to be truncating below the base of upper Cretaceous unconformity over the structure. Many prolific hydrocarbon-producing wells in the Arabian Gulf are from the Cretaceous sequence.
Al-Fares explored the stratigraphic and facies framework of the entire Cretaceous sequence and its lower, middle, and upper Cretaceous facies distribution in the Arabian Gulf.
Stratigraphically, the Wara formation occurs in the Middle Cretaceous sequence, which is also widely distributed in the Arabian Gulf. It is conformably overlain by the Ahmadi and underlain by the Mauddud formations. The lithology is mainly composed of shale, sandstone, and calcareous sediments.
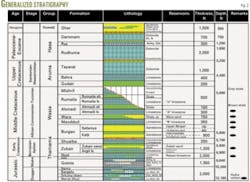
Fig. 2 shows a generalized stratigraphy of the Al-Khafji field, in which the Wara formation shows alteration of shales, siltstones, and sandstones with some calcareous material in the upper and lower portions of stratigraphic column. The gross formation thickness varies from 150 to 205 ft.
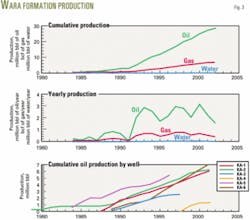
Fig. 3 shows the production status of key wells producing from the Wara formation of the main Al-Khafji oil field. Burgan sandstones of the Wasia group appear to dominate the reservoir facies.
The upper part of the Wasia formation contains thick shales. Another sand unit, the Wara of the Wasia group lies between the Ahmadi and Mauddud formations. The Wara sandstone contains the hydrocarbon reservoir and is the subject of the study on determining the spatial distribution of porosity by combing 3D seismic attributes with well data.
Underlying the Wasia formation is the Thamama that contains shales and possible fossil facies.
The area has limited gravity and magnetic surveys and sparse well data describing both the vertical and lateral variations of the Wara unit within the 350 sq km coverage of the 3D seismic data.
This area contains 62 wells. The wells have core samples, porosity measurements, and wireline logs and all were included in a petrophysical analysis.
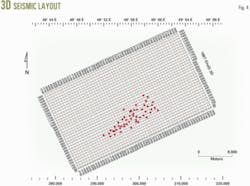
Fig. 4 shows the layout of the 3D seismic layout.
Reservoir mapping
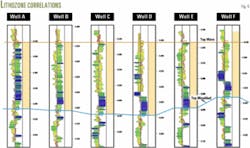
In the study, a regional geological marker, well data, and an interpreted time horizon identified a prospective lithozone (Fig. 5) between the top of the Wara and Mauddud formations.
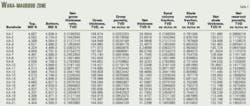
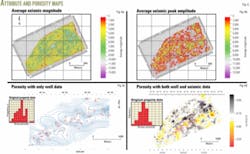
The analysis included the use of a reservoir-property summation module (RESUM) for calculating interval properties such as gross porosity and sand fraction volume (Table 1). This analysis generated 25 different attribute maps from the interpreted 3D seismic data volume between the top of Wara and Mauddud formations (Figs. 6a and 6b).
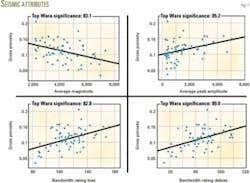
Fig. 7 shows cross plots of the attribute values at the wells vs. porosity. A "significance estimation" method determined the degree of correlation between seismic attributes and porosity. The purpose of significance estimation was to quantify which attributes affect porosity measurements. The algorithm, based on the Kendall-Tau indicator, determines for each attribute-porosity pair a probability value for the measured random relationship.
The study selected eight attributes based on the significance value and the calibration function estimated at each intersection. A guided mapping technique, consisting of the following steps, obtained the final porosity map on the entire seismic grid:
1. Apply calibration function by converting the seismic attribute grid to porosity grid using estimated calibration function.
2. Calculate a residual scatter by computing residual values at well locations.
3. Compute residual grid by generating a residual grid based on the residual scatter set.
4. Apply the residual grid by correcting the porosity grid to the residual grid and ensuring a match between the well data and the final porosity grid.
5. Estimate confidence by determining the estimated error between the well data and final porosity grid.
Porosity maps interpretation
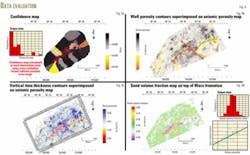
Figs. 6c and 6d are porosity maps computed respectively from well data and combined seismic and well data. The porosity values range between 3 and 22% with mean values between 10 and 12%.
There is a high degree of confidence (Figs. 8a and 8b) between well and seismic derived porosity at well locations. The confidence map (9a) shows a possible error range in porosity values that is almost negligible. This implies that the seismic derived porosity map depicts exactly the actual porosity of the Wara formation throughout the mapped area.
The central part of Al-Khafji field shows a relative high-porosity trend that several wells have established. This trend correlates with a channel system deduced from well data.
The interpretation shows a sudden 5% porosity decrease in the eastern part of main Khaji field and an increase to 22% porosity further to the east. A fault zone cutting the structure high may have caused this change.
As shown in 9b, the study interpreted a channel feature extending toward the east of Al-Khafji field. The localized high-porosity anomaly in the eastern part of Al-Khafji field may be a localized geological feature.
The vertical time-thickness map (Fig. 9c), when superimposed on the final porosity map, shows more thickness in a better porosity development area. This possibly indicates the existence of a sand body.
A sand fraction volume map (Fig. 9d) confirms the presence of sand prone areas (50-60%) similar to favorable porosity development zones.
Oil play analysis
The Burgan sandstones of the Wasia group appear to dominate reservoirs in this basin. Burgan sandstones consist of Safania and Al-Khafji sand units with minor shale intercalations. The interpretation is that the Safania sand unit is thicker than the Al-Khafji sand unit. All these sandstones are potential reservoirs.
The upper part of the Wasia formation consists of shale and limestones that appear to be acting as seals for Wara reservoirs, while the source rock may be the Thamama group underlying the upper Wasia formation. The Thamama consists of shales and calcareous material with possible fossil facies.
The interpretation of the study area is that both stratigraphic and a combination of trapping mechanisms (strati-structural) control the hydrocarbon distribution; in other words, both structure as well as on lapping or wedging out of the Wara sand facies in the updip-direction and shaling-out within basin affect the distribution.
Seismic anomalous features suggest the presence of scalable facies changes and at places lens-type deposits that also indicate stratigraphic control.
Porosity– amplitude relationship
Literature discusses a variety of techniques for relating reservoir porosity or the product of porosity and thickness to seismic attributes. The appropriate approach depends on the nature of relationship between various reservoir parameters that affect the seismic data.
For a thin reservoir, such as in Al-Khafji field, the study used an approach that searched by a simple direct relationship between reflection amplitude and porosity attributes.
The analysis had to correct the phase of the seismic data to find a linear relationship between the reflection amplitude at the top of Wara formation and the average log-derived porosity in the reservoir, using data from nearby exploration or development wells.
The porosity-amplitude cross plot uses the phase-corrected seismic data. The statistics from the porosity-amplitude trend provide an insight into how best to use the information. Predictions of absolute porosities on a larger scale could be difficult because of errors associated with absolute predictions.
But the slope of the cross plot is well defined, so that the relationship is useful for determining the best porosity in a local area. It is useful to know the slope, not just that there is some trend, because it provides an indication of the trade off between location, from a reservoir-drainage standpoint, and porosity. The slope also can indicate how much porosity can be gained by moving a certain distance from the best drainage location.
The porosity-amplitude trend when combined with a reflection amplitude map produces an estimated porosity map of the entire field. Then the estimated porosity combined with the interpreted Wara structure can be rendered in 3D displays with existing or proposed locations.
This visually integrates the structural and porosity data in one display.
3D seismic imaging
Imaging 3D seismic enhances the examination of complex geological situations and the planning for development well locations. Typical problems that 3D imaging may resolve include, reservoir compartmentalization that requires significant infill drilling to maximize recovery. Another issue is questionable fault continuity that imaging may resolve.
The 3D seismic imaging also may enhance the structural pattern of the oil field that may control the distribution of reservoirs. In the case of Al-Khafji oil field, longitudinal and transverse faults also control reservoir distribution.
Reservoir quality prediction in sparse well grids is another issue that has been addressed successfully with rigorous analysis of seismic amplitudes and their characteristics. An analyst can use the reservoir quality indicator on the 3D seismic amplitudes to target well locations and map pore fill.
For example, flat spots representing positive acoustic impedance contrasts for down-going waves can also establish the polarity of seismic section. From this, one can also establish the relative acoustic impedance of the sealing shale and the sand below. At times, sands can have lower impedances than the sealing shales because the polarity of the top reservoir could be the same down the flank (at the oil-water contact) as at any crestal bright spot.
Imaging of 3D seismic can locate better field production boundaries to indicate untested structural blocks. This was the case, particularly in the eastern part of the Al-Khafji field area. The imaging of closed-grid 3D seismic also aided in providing new concepts related to the petroleum geology and spectral analysis of seismic attribute characteristics of Al-Khafji field.
The study of 3D seismic attributes also aids the determination of reservoir composition, distribution, and lateral variations. These seismic data can also be inverted to acoustic impedance (density and velocity) and transformed into reservoir parameters.
Cross plot regression analysis of petrophysical parameters can provide similar relationships between a pair of values of porosity, acoustic impedance, permeability, and water saturation.
The combination of petrophysics and geophysics is a tool that can help develop seismic criteria for optimizing development well locations. In the Al-Khafji area, these analyses helped interpret and map the faults associated with reservoirs, aiding future drilling plans.
The resulting empirical amplitude-porosity relationships successfully predicted the gross reservoir porosity in several seismic locations away from wells in this basin.
Future work
Reservoir modeling is an evolving process and for evaluating the Al-Khafji field all known exploration data needs to be integrated into the models. The reservoir models will need to be continually improved as new exploration data are obtained and incorporated.
Geologists and geophysicists will continue to struggle with improved data integration and continue to evaluate the uncertainty of estimating hydrocarbon volumes with several data-mining techniques. Many proven data-mining techniques including statistical techniques will help establish the Al-Khafji field lateral and vertical reservoir limits more precisely.
The use of the amplitude-variation-with-offset inversion technique also may verify the increasing porosity in the eastern part of the main Al-Khafji field. Volume reflection spectrum and neural networking may further refine the porosity data.
Other multipay horizons of Al-Khafji field also may benefit from similar studies. Reservoir models generated in the present study may guide reservoir engineers for further detailed modeling studies.
Seismic trace characteristics such as frequency and time-domain analysis of seismic traces falling in and around the main Al-Khafji field also will ascertain the spatial extension of reservoir facies.
Acknowledgments
The authors thank Kuwait Gulf Oil Co. and Ministry of Energy, Kuwait for permission to publish the results of this study. They also are grateful to Qasem Al-Mejadi and Mubarak Al-Hajeri for their support. Thanks also go to Les Crowder, Aavo Taal, Hajime Kusaka, Ali Al-Najdi, and Humoud Al-Otaibi for their valuable technical comments. The authors also thank N.L. Shastri for review and help with the manuscript.
Reference
1. Al-Fares, A.A., Bouman, M., and Jeans, P., "A New Look at the Middle to Lower Cretaceous Stratigraphy, Offshore Kuwait, GeoArabia," Vol. 3, No. 4, 1998, pp. 543-60.
The authors
Kalyan Chakraborty is a specialist geophysicist with Kuwait Gulf Oil Co. He previously worked for the Oil and Natural Gas Commission, the Geological Survey of Western Australia, and Petroleum Geo-services, Australia. Chakraborty has an MSc Tech in applied geophysics from Indian School of Mines and an MSc in petroleum exploration from Curtin University of Technology, Perth, Australia. He is a member of SEG, AAPG, PESA, and AEG.
Ahmad Mostafa is a senior support administrator at Kuwait Foreign Petroleum Exploration Co. He previously worked as a geophysicist for the General Petroleum Co., Geco-Prakla (EAR), and Schlumberger-GeoQuest. Mostafa has a BS in geology from Cairo University.
