Where we are going: SWOT analysis aids risk assessment
LNG RISK PROFILE—Conclusion
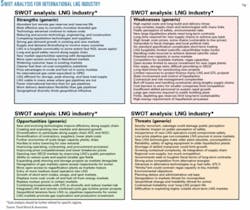
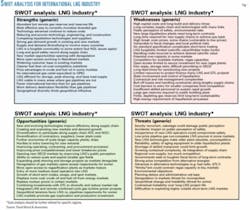
The evolution and developments described in Part 1 of this series (OGJ, Jan. 24, 2005, p. 54) have fundamentally changed the nature of the international LNG industry particularly in the past 5 to 10 years. It is with these new international LNG market dynamics in mind that this concluding article presents a generic Strengths-Weaknesses-Opportunities-Threats (SWOT) analysis (Fig. 1).
The point of a generalized analysis is to identify in summary form the key issues that now influence the industry. This should provide a useful starting point for analysis of specific supply chains, which typically will be influenced by some, but not all, of the SWOT issues.
As with most SWOT analysis, some issues will be strengths or opportunities for certain players, but weaknesses for other players in the same LNG supply chain.
For example, attitudes towards deregulation will differ depending upon whether you hold and are striving to maintain a monopoly market share in an existing regulated market or are a new player trying to break into that market.
In the generic SWOT presented here, some issues therefore appear under more than one category.
There are significant lists of issues under each category underlining the complexity of the industry, its supply chain, its markets, and the issues it is currently confronting. The issues listed in Fig. 1 in reality only represent a starting point for a detailed SWOT analysis, which should go far beyond the issue-listing approach and develop scenarios and strategies to exploit strengths and opportunities and mitigate weaknesses and threats.
Without a detailed understanding of the evolving structure and contractual relationships of the LNG supply chain, however (as described in Part 1 of this series), it is unlikely that even meaningful lists of issues could be constructed for each element of the generic SWOT analysis.
Appropriate strategies to develop to achieve future success within the LNG industry will depend upon the nature and perspective of the participant (i.e., national oil company, international oil company, contractor, financier, insurer, shipper, trader, utility, etc.). Clearly some of the issues identified have more relevance to some participants than others.
Risk, opportunity drivers
Regardless of the participant, a useful next step to take the SWOT analysis further is to consider risks and opportunities facing the LNG industry and attempt to group them into meaningful categories. The scale of this task makes it necessary to focus such analysis on specific projects along the LNG supply chain.
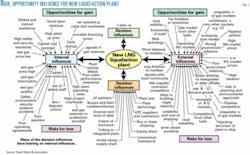
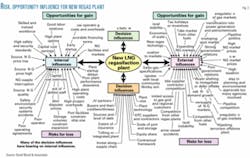
Figs. 2 and 3 illustrate risk, opportunity, and decision-influence diagrams associated with a new (generic) liquefaction plant and a new (generic) regasification plant, respectively.
In these diagrams, opportunity-for-gain influences are in the top half and risk-for-loss influences are in the lower half. The influences are further divided into those internal to the project (left side) and those external to the project (right side).
The central segment of the diagram identifies those fundamental issues that represent key decision influences. Many of the decision influences will bear on the internal influences and themselves be influenced by the external influences. Hence, the influences are not independent of each other and are shown as such only for diagrammatic simplicity.
Reviewing these influence diagrams together with the issues identified in the SWOT analysis will help to focus on the key risk-opportunity profile of a specific project.
Comparing Figs. 2 and 3 reveals that some of the influences are the same, but others are distinctly associated with that specific sector of the supply chain. A similar influence diagram for the shipping sector (not shown) would also include some overlap with the liquefaction and regasification influence diagrams, but some influences are fundamental to the shipping sector.
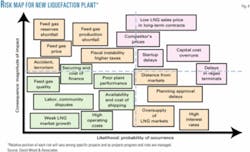
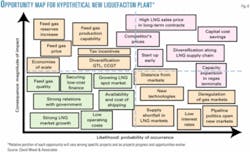
With influences categorized in this way, it is now possible qualitatively to map them to establish the most significant (for a specific project) in terms of their consequences (financial, commercial, social etc.) and likelihood of occurrence.
Those influences with the high consequences combined with high likelihood of occurrence will plot in the northeast quadrant of the map and represent the key risks or opportunities. It is appropriate to consider risks and opportunities separately because they require different strategic approaches.
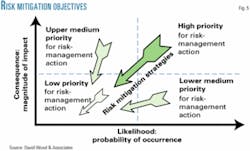
Fig. 4 shows a risk map for a hypothetical new liquefaction plant. A distinct risk map will be derived for each specific project and specific risks will plot in different relative positions. Fig. 5 identifies the significance of the risks in each quadrant of the risk map.
The arrows in Fig. 5 illustrate the objectives of risk management and mitigation strategies, i.e., to move the key risks initially located in the northeast quadrant and the significant risks of the northwest and southeast quadrants into or towards the southwest quadrant.
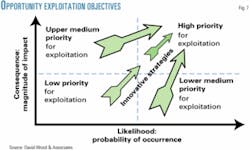
Figs. 6 and 7 show similar examples of opportunity maps and opportunity exploitation strategic objectives for a new liquefaction plant.
Such qualitative mapping and analysis can be extremely useful in highlighting key risks and opportunities and in developing strategies to address them. Such analysis can only go so far, however, without risk and opportunity management requirements for more detailed quantitative analysis (i.e. assigning numerical values to consequence and probabilities to likelihood of occurrence) for each influence event.
Supply-chain structures affect risk
The growing complexity of contractual relationships and structures of some modern LNG supply chains is evinced by international oil and gas companies, national oil companies, and utilities now participating at several points along a typical supply chain in order to extract more value, spread risk, and establish more security of offtake or supply.
This contractual complexity, increased diversification, and de-integration result in some risks increasing, others being offset, and new opportunities materializing.
This second article expands upon the first's description of the modern complex LNG industry, describing it in terms of a SWOT analysis and risk-opportunity influence diagrams. For such analyses to be meaningful, they must take into account the recent structural changes that have affected LNG supply chains.
An in-depth understanding of the supply-chain structure, contractual relationships, and markets making up the LNG industry, together with integrated and systematic risk-opportunity assessment techniques, are therefore essential for effective risk management within the industry.
