Blake Ridge provides data for assessing deepwater gas hydrates
GAS-HYDRATE PRODUCTION—Conclusion
Three scenarios using data from the Blake Ridge area off the US southeastern coast explain possible ways for exploiting gas-hydrate deposits found in deep water.
This is the concluding part of a two-part series on gas-hydrate production. The first part (OGJ, Feb. 7, 2004, p. 43) covered gas-hydrate production from the onshore Messoyakha gas field, in the arctic region of Russia.
In this part, the authors do not determine if gas can or cannot be produced at Blake Ridge but use published data from seismic and wells drilled in Blake Ridge to evaluate three possible scenarios for producing gas-hydrates from deepwater deposits.
Blake Ridge
Data gathering, during the past 20 years for the gas-hydrate deposits in the Blake Ridge area, in the Atlantic Ocean, off the US southeastern continental margin, have included numerous seismic surveys and data from 11 wells.
The observation of a bottom-simulating reflector (BSR) was the first indication of these gas-hydrate accumulations that lie in 1-4 km of water and cover a 26,000 sq km area.
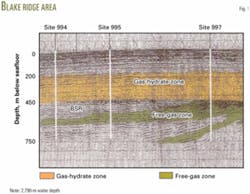
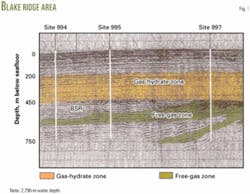
The Ocean Drilling Program (ODP) Leg 164 at Sites 994, 995, and 997 confirmed the occurrence of these gas hydrates.2 3 Although this program did not observe a BSR at Site 994, it did find a modest BSR at Site 995, and saw a strong BSR at Site 997 (Fig. 1).
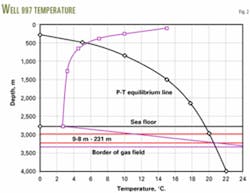
As shown in Fig. 2, the area has a relatively thick free-gas layer at a depth of 3,216 m in Well 997, directly under the BSR at the lower hydrate formation zone (HFZ) boundary. This zone has a 53% porosity and gas saturation ranges from 1% to 5%. The free-gas zone thickness in Wells 994 and 995 are about 64 and 36 m, respectively.
Estimates of free gas in place in different layers vary from 0.9-14.5 bcf/sq km. Some estimates indicate that the area contains as much as 680 tcf of free gas in place. Within the limits of the Blake Ridge area, total gas-in-place of the combined zones containing gas hydrates and free gas could be as high as 2,010 tcf.1
Thermodynamic, geology
Gas-hydrate deposits in the Blake Ridge area are in Mesozoic and Cenozoic sediments that have a thickness greater than 10 km. This area is 150-450 km from shore and lies in water deeper than 2 km. Reference 4 presents a complete description of Blake Ridge geology.
Large-amplitude BSRs are seen often on seismic surveys along the Atlantic margin.5 6 These BSRs have been extensively mapped at two locations off the US east coast along the Blake Ridge.5 7
Blake Ridge is a positive topographic sedimentary feature on the US continental slope. The crest of the ridge extends about perpendicular to the general trend of the continental rise for more than 500 km to the southwest. The Blake Ridge consists of Tertiary to Quaternary sediments of hemipelagic muds and silty clay.2
The thickness of the methane-hydrate stability zone in this region ranges from zero along the northwestern edge of the continental shelf to a maximum thickness of about 700 m along the eastern edge of the Blake Ridge.1
According to initial data, Well 997 penetrated the largest gas-hydrate zone in this area. Fig. 2 shows the temperature profile of the hydrate deposit measured at this well.
Well 997 is in 2,782 m of water and has a 2.7° C. mud-line temperature. The geothermal gradient is 3.7° C./100 m. The well has a 440-m thick hydrate-stability zone with the BSR at 440 m below the mud line.
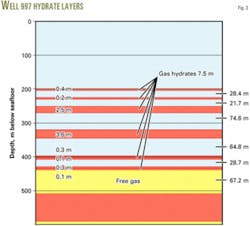
The hydrate formation zone (HFZ) in Well 997 has nine hydrate layers (Fig. 3) with individual thicknesses of 0.1-3.6 m and a 7.5-m cumulative thickness at a depth of 203-434 m below the mud line or 2,985-3,216 m below sea level.5
Hydrate is mainly concentrated in two layers that have a 2.5 m and 3.6-m thickness at 256 and 330 m depths below the mudline, respectively. A 75-m thick, low permeability, water-saturated zone separates these two thick hydrate layers.
These two layers contain 81% of the hydrates in the well. The average hydrate saturation of the entire gross interval from 200 m below the sea floor to the free-gas level is only 3.9%.1 The hydrate gas has a composition of 99.98% CH4 and 0.02% C2H6.3
Three cases illustrate the amount energy required for producing natural gas from the hydrates under difference production scenarios, as follows:
1. Case 1 attempts to produce all the gas-hydrate zones in the gross-thickness. Case 1 will never be economical because the gas hydrates are too dispersed in the gross geologic section.
2. Case 2 assumes that only the 2.5 and 3.6-m layers are develop and produced.
3. Case 3 refers to a thick gas-hydrate lens that seismic has identified in the Blake Ridge area.8 Case 3 offers the most promise for gas production.
Case 3 uses information from Hornback.9 Using seismic data, Hornback identified a relatively small lens (1.9 by 11 km) containing a thick hydrate-bearing zone that is about 95-m thick.
The lens covers less than 0.1% of the total Black Ridge area with a BSR, but it is of interest when considering whether the gas hydrates are producible, at least in the area of the lens.
The lens volume is about 2 cu km, and the sediments have a 37% porosity. The hydrate saturation in the pores is 47%, and the lens contains more than 1.8 tcf of hydrated gas in place.
Obviously, for other cases that differ from the three defined in Table 1, other outcomes and conclusions may result from an analysis similar to that described in this article.
Producing hydrate deposits
Table 1 and Figs. 1-4 provide the basic data used in this analysis.
Directly above the BSR in Blake Ridge are several thin hydrate layers with a total thickness of 33 cm that contain only a small percentage of total hydrate in place.
These thin zones are the only layers that could be developed by the depressurization method used at Messoyakha because these layers are the only ones possibly in contact with the free-gas zone. A 28.7-m thick water-saturated layer lies above these two hydrate layers.
As previously mentioned, the two main gas-hydrate layers have a 2.5 m and 3.6 m thickness. These two zones provide the most potential for development among the nine layers because they contain 81% of the gas-in-place.
Above these two main layers are three layers with a 60-cm total thickness. These shallower layers cannot be produced economically; instead, they will serve as a seal to enable production from the lower layers.
In a normal gas field, free gas flows into the wellbore because the wellbore has less pressure than the reservoir. In gas-hydrate deposits; however, flow depends on first transforming the hydrate from a solid into a gaseous state before gas can be produced. As stated in Part 1, one can transform gas from the hydrated state into a free state by:
- Lowering the pressure below the equilibrium pressure.
- Increasing temperature above equilibrium temperature.
*Shifting the equilibrium through the introduction of chemicals into the deposit.
The method selected for each reservoir depends on specific thermodynamic conditions of the hydrate deposit.
Fig. 4 illustrates where the 17 offshore gas-hydrate deposits in Table 1 of Part 1 (OGJ, Feb. 7, 2005, p. 43) are positioned vs. the pressure-temperature (P-T) hydrate equilibrium relationship. Also shown in Fig. 4 is the position of Messoyakha field.
The position of each data point is very important when it comes time to select a method for producing gas from a hydrate deposit.
For example, the Messoyakha gas hydrates are at conditions near the hydrate P-T equilibrium line. Because of this, gas can be produce from the hydrate with only a small reduction in pressure or a small increase in temperature.
The same is true for the Nankai-1 and Blake Ridge-2 data points. The other deposit data points, such as Blake Ridge-1, Bush Hill, or Nankai-2, however, are a long way from the P-T equilibrium line. For these and similar deposits, the dissociation of gas from the hydrate requires large pressure reductions or large increases in temperature.
In fact, for most of the gas-hydrate deposits in Fig. 4, the depressurization method is impractical because of the large pressure changes required. The most practical method to produce these gas hydrates is to increase the temperature in the gas hydrate and the surrounding rock layers.
The following discussion uses the data in Fig. 4, along with the geologic and thermal properties of the gas-hydrate deposits to determine the energy required to melt the hydrates.
Depressurization method
The industry can develop deposits that exist at conditions close to hydrate equilibrium conditions, such as in Messoyakha field (Fig. 4), by simply producing the free gas to reduce the pressure below the equilibrium pressure at the interface of the free gas and gas hydrate. For Blake Ridge conditions, this development method possibly only applies to the 33-cm-thick layer (4% of the total hydrate deposit). Releasing gas from the remaining 96% of the hydrates would require heating the zone.
In Fig. 4, note that the pressure in the Blake Ridge gas hydrates (as is true for most deepwater gas-hydrate deposits) would require a substantial pressure reduction before the gas hydrates begin to dissolve. In Blake Ridge, the hydrate dissociation in the shallower hydrate, 30 m above the BSR (Fig. 4), requires a pressure decrease of 1,100 psi.
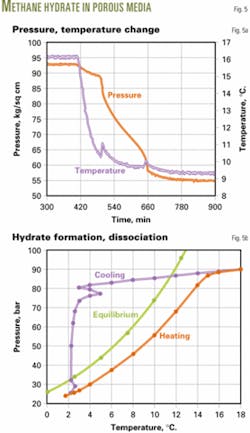
For the thickest hydrate layers, which are 104 m and 179 m above the BSR and at 330 m and 256 m below the sea bottom (3,112 m and 3,037-m total depth), hydrate dissociation requires a 2,350 psi and 2,930 psi reservoir pressure, respectively. This takes into account the effect of hydrate self-preservation. Fig. 5 illustrates the effect of the self-conservation of methane hydrate in porous media.10
Because of the large pressure decrease required, our conclusion is that it is not feasible to produce gas from the hydrate layers in the Blake Ridge by depressurization only.
Chemical injection
Chemical injection into the layers of hydrate in the Blake Ridge conditions would not be cost effective; in fact, in our opinion, chemical injection will not likely be a viable alternative in any gas-hydrate deposit anywhere.
Thermal methods
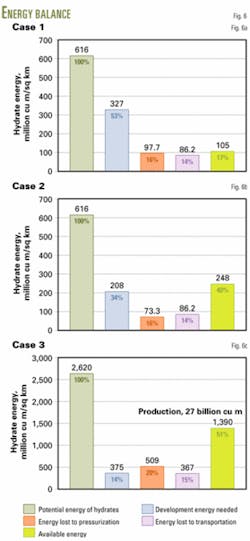
Thermal methods, we believe, are the only possible production mechanism for producing gas hydrates from deepwater deposits. Our analysis uses data from Table 1 and Figs. 1-5 to estimate the amount of energy required to produce gas from the hydrates for the cases in Fig. 4. Figs 6a-6c show the results of the calculations.
The definitions of the terms in Fig. 6 area as follows:
- Potential energy of hydrate is the total amount of energy in 100% of the gas-in-place in a 1 sq km area.
- Development energy needed is the amount of energy needed to heat the gas-hydrate layers and all the rocks between the layers so that the gas hydrates disassociate.
- Energy loss to pressurization is the residual gas-in-place not produced, such as the gas in place at abandonment conditions.
- Energy loss to transportation is the amount of energy required to process and transport the gas through a pipeline to a shore facility.
- Available energy is the amount of gas produced and sold.
Obviously, many unknowns remain concerning gas-hydrate production. Data in Table 1 and Figs. 6a and 6b, however, illustrate that some deposits require a large portion of the available energy for heating the reservoir and transporting the gas. This decreases the amount of available gas that can be produced and sold.
As illustrated in Fig. 6a, Case 1 requires heating of both the gas-hydrate layers plus all the rocks in between the gas-hydrate layers in the gross interval. This amount of heating obviously is impractical because the heating requires 53% of the energy-in-place, leaving only 17% of the energy-in-place for production and sales. In addition, transportation requires another 16% of the energy-in-place.
In Case 2 less rock has to be heated. The case considers only the two thickest layers in Fig. 3, which contain up to 40% of total gas from hydrates. The two zones in Case 2 contain about 81% of the gas hydrates.
For Case 2, the energy used for thermal dissociation of hydrate is 34% of the total energy-in-place (Fig. 6b). Despite the fact that the case develops only two of the layers, the overall gas production will double because it requires less energy to heat the rocks between the gas-hydrate layers.
Fig. 6c shows the distribution of energy from hydrates necessary to produce gas from the hydrated lens in Case 3. This lens covers only 21 sq km but has a concentrated volume of gas hydrate that could be ideal for development and production.
The analysis (Fig. 6c) shows that Case 3 results in the production of almost 50% of the gas-in-place.
References
1. Collett T.S., and Ladd, J., Detection of Gas Hydrate with Downhole Logs and Assessment of Gas Hydrate Concentration on the Blake Ridge, Ocean Drilling Report, Vol. 164, 2000.
2. Dillon, W.P., and Paull, C.K., "Marine gas hydrates-II: Geophysical Evidence." In Cox, J.L., ed., Natural gas hydrates—properties, occurrences and recovery, Boston: Butterworth Publishers, 1983, pp. 73-90.
3. Paull, C.K., Matsumoto, R., Wallace, P.J., and Dillon, W.P., editors, Proc. Ocean Drilling Program (ODP), Scientific Results, Leg 164: College Station, Tex., 2000.
4. Dillon, W.P., and Popenoe, P., "The Blake Plateau basin and Carolina Through." In Sheridan, R.E., and Grow, J.A., editors, The Atlantic Continental Margin, USGS, 1988.
5. Dillon, W.P., Lee, M.W., Felhaber, K., and Coleman, D.F., "Gas hydrates on the Atlantic margin of the USA—controls on concentration, The Future of Energy Gases," US Geological Survey, Professional Papers, 1993.
6. Lee, M.W., Hutchinson, D.R., Dillon, W.P., Miller, J.J., Agena, W.F., and Swift, B.A., "Method of estimating the amount of in-situ gas hydrates in deep marine sediments," Marine and Petroleum Geology, Vol. 10, 1993, pp. 496-506.
7. Tucholke, B., Bryan, G., and Ewing, J., "Gas Hydrate horizons detected in seismic-profiler data from the western North Atlantic," AAPG bulletin, 1977, p. 61.
8. Lorenson, T.D., "Graphic summary of gas hydrate occurrence by proxy measurements across the Blake Ridge, Sites 994, 995, and 997." In Paull, C.K., Matsumoto, R., Wallace, P.J., and Dillon, W.P., editors, Proceedings ODP Scientific Results, 164: College Station, Tex. Ocean Drilling Program, pp. 247-249.
9. Hornbach, M.J., Holbrook, S.W., and Gorman, A.R., "Direct seismic detection of methane hydrate on the Blake Ridge," Geophysics, Vol. 68. No. 1-2, 2003, pp. 92-100.
10. Makogon, Y.F., "Effect of hydrate self-conservation," DAN, Vol. 390, No. 1, 2003.
