PDM performance depends on internal geometries
PD MOTORS—1
PDM performance can be predicted with analyses based on fluid mechanics and kinematic relationships.
Downhole positive displacement motors (PDMs) are commonly used in directional drilling of oil and gas wells to navigate drill bits toward a lateral target.1 Many PDMs are available for use in bottomhole assemblies (BHA); each generally described by the lobe configuration. Each PDM has its own performance characteristics, which depend on internal geometry.
This first of two articles explains the governing equations relating internal geometry and performance. The concluding article will give the rationale for selecting a particular PDM for a given drilling situation.
Technical advances in PDM design and measurement-while-drilling (MWD) technology now allow directional wells to be drilled along a predetermined well path and reach a lateral target with a high degree of accuracy. Basically, one BHA can be used throughout the build portion of the well, eliminating multiple pipe tripping. A key aspect is the placement of the BHA bend within the motor and close to the drill bit.
In this case the bend is small and permits drillstring rotation simultaneously with motor output rotation. When hole corrections are needed, the drillstring rotation is stopped, the tool is oriented, and the drilling progresses with only the PDM.
The selection process should match PDM performance with available hydraulic horsepower, expected bit torque, and cleaning requirements. It is not the intent of this article to promote one motor type over another but rather to give a rationale for equating motor performance to specific drilling situations.
These downhole drilling motors, coupled with MWD tools and proper stabilization, allow directional wells to be drilled with one bottomhole assembly, eliminating costly multiple drillstring tripping, which in the past was necessary for surveying, hole corrections, and stabilizing assemblies.
Energy conversion
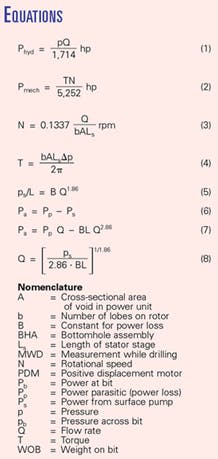
Downhole drilling motors extract energy from the moving fluid or drilling mud in the form of pressure and flow rate (Dp, Q) and convert this hydraulic power to mechanical power in the form of torque and rotational speed (T, N). These two forms of power (hydraulic and mechanical) appear in Equations 1 and 2 (see equation box on next page), with units of psi for the pressure drop, gpm for the flow rate, ft-lb for torque, and rpm for rotational speed.
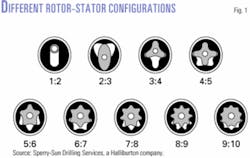
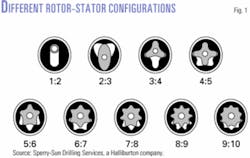
The PDM transforms hydraulic power into mechanical power through the inner workings of the motor. The relation between output torque (T) and rotational speed (N) depends on the geometry of the rotor and stator. There are many combinations of rotor lobes and stator cavities, as shown in Fig. 1.2 The idealized equations for predicting the performance of PDMs for various pairs of rotors and stators are based on analyses that combine fluid mechanics and kinematic relationships.
The following analysis, omits the effects of friction and leakage through the motor. These factors can be sizable. The operator-contractor should obtain actual performance data from the manufacturers, which is typically obtained from bench testing in a laboratory. Nonetheless, the equations provide a reasonable basis for predicting expected output speed and torque.
An advantage of PDMs is that output performance (T,N) can be monitored from the rig floor by tracking standpipe pressure and flow rate. The difference between off-bottom and on-bottom standpipe pressures represents pressure drop across the motor during drilling for a given weight on bit (WOB). Flow rate through the drilling system can be translated into output rotary speed (Equation 3, using units of square feet for A, the difference between cross-sectional area of stator and rotor; and feet for Ls, the length of one stator stage).
Under the same flow rate conditions, changing the volume (ALS) of the PDM or the rotor:stator ratio (b) can alter the rotational speed. If the volume is held constant, a motor with 1:2 rotor-stator lobe ratio would operate at a higher speed than a 5:6 or a 9:10 motor. Generally the 1:2 motors operate between 200 and 900 rpm, which at the bottom end of their performance is still rotating at the top end of the 4:5 and 5:6 motors' capabilities.
Equation 4 calculates the torque generated by a PDM that is 100% efficient.3 4
Note that generated torque increases with stator stage length. Torque is the result of the fluid wedge driven into the top end of the motor.
The smaller the wedge angle, which dependes on lobe configuration and stage length, the greater the wedge force or torque.
An alternative derivation of torque through an internal force balance would show that no torque or work is achieved over an enclosed stator stage. Thus mechanical power is developed as a result of the pressure difference between one side of the top rotor stage and the opposite side of the bottom rotor stage.
Despite this fact, most motors are made up of several stator stages. The extra stages act as a dynamic seal against leakage. The more stages the better the seal, but this number is limited by the resulting increase in friction due to the extra stages. Most motors range from three to five stages.
Performance diagrams
Equation 4 shows that for a given allowable pressure drop across a motor, mechanical torque will increase with an increasing number of lobes on the rotor. Even though "A" and "Ls" are also factors, they do not have the effects of "b." At the same time, however, output rotational speed is reduced by the inverse of "b," according to Equation 3. The number of lobes then dictates output torque and speed for a given set of pressure drop and flow rate.
The availability of a wide range of motor lobe configurations allows flexibility in tailoring motors for each specific drilling situation. Typically drilling torque is around 1,500 ft-lb and bit rotational speed around 100 rpm for normal rotary drilling. Bit type, hole size, and formation may induce much higher torque, for example in the drilling of surface holes. In this case, multi-lobed motors may be a good choice.
Equations 3 and 4 are useful in the design of motors to satisfy a given set of performance specifications and for predicting performance of motors under ideal operating conditions. However, actual PDM performance can only be determined from bench testing each motor.
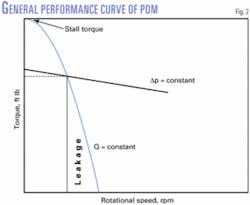
A typical test procedure involves attaching a motor to a test stand and a dynamometer. The two controlled variables are usually flow rate, Q, and torque, T. Output rotational speed and pressure drop across the motor are dependent variables in the tests. Flow rate is held constant for a given set while torque is applied by means of the dynamometer. Resulting rotary speed and pressure drop are recorded along with flow rate and torque. Performance data of this type can be displayed in a performance diagram as shown in Fig. 2.
When no torque from the dynamometer is applied, the rotational speed is at its maximum. At this point the differential pressure over the motor is just large enough to overcome the friction with in the power unit. This point is the smallest differential pressure or no-load pressure for the motor. As the torque is increased by the dynamometer, pressure drop across the motor increases too but not in direct proportion as indicated by Equation 4.
Likewise the direct relation between output rotational speed and flow rate deviates from Equation 3. Both of these effects are due to fluid leaking past across rotor and stator. Because of leakage and internal friction, output mechanical power is less than input hydraulic power making PDMs less than 100% efficient.
The increase in torque also causes differential pressure to increase. The torque level that corresponds to zero rotational speed is the "stall point." Under this condition all of the fluid is leaking across rotor and stator. As a general rule, recommended operating torque (pressure drop) is around two thirds of stall torque. Overall performance data give a picture of how a given motor will perform under a full range of operating conditions.
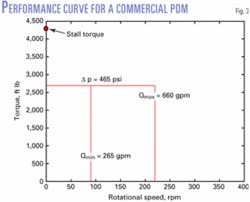
Published performance data on a motor usually gives a recommended range of operational flow rates and pressure drops, as depicted in Fig. 3. The upper flow rate is limited by internal friction within the motor, and the lower flow rate is limited by desired efficiency of the motor. This engineering approximation of motor performance lends nicely to systems analysis and will be the basis of further discussions in this article.
Integrating PDMs into circulating systems
Next, the rationale for selecting PDMs and integrating them into a particular drilling system for best rate of penetration will be explored. In essence this usually means making the best use of the available hydraulic power at the bottom of the drillstring for driving downhole motors and bit cleaning. Bit torque, flow rate, and hole cleaning are also considerations.
Surface pump performance
The source of power for circulating systems is the mud pump at the surface. Horsepower ratings define the relation between output fluid pressure and flow rate. For example, a 1,500-hp surface pump supplies power according to Equation 1:
Phyd=p Q/ 5,252 hp
or
p Q=5,252 x 1,500
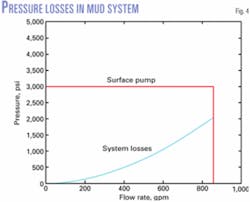
If, for example, the maximum operating pump pressure is 3,000 psi, the corresponding flow rate would be established from the above equation as 857 gpm. These numbers would change according to liner size. Usually the pump is operated at the maximum allowable output pressure and at flow rates up to the maximum allowable flow rate. Fig. 4 shows this type of pump performance information. These numbers are used in the systems analysis discussion, which follows.
Available hydraulic power
The hydraulic power that is available at the bottom of the drillstring is the difference between power supplied by the surface pump and power lost through the circulating system, including surface equipment and downhole drillstring components. It is not the intent of this article to focus on pressure-loss determinations of each component. It will be assumed for the sake of our discussion that system losses follow the formula in Equation 5, where the depth of the well is in units of ft and the loss factor5 is dimensionless.
Note that B depends on pipe size, mud properties, hole depth, etc., and varies slightly for different depths because of the changing annulus size. The annulus' contribution to the total losses is a small percentage as compared to that of the pipe. This equation plots as a parabola (Fig. 4). For this plot, B is an average value over several well depths and sizes.
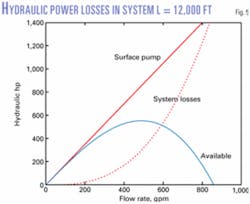
Because power is a better measure of performance than pressure, we choose to display available hydraulic horsepower at the hole bottom (Fig. 5). Available horsepower is the difference between surface pump power and system losses.6 All three depend on flow rate. Note the relation in Equation 6 between the available hydraulic power at the bottom of drillstring (Pa); the power supplied by the surface pump (Pp); and the power consumed in fluid friction within the system (Ps).
Rearranging and replacing yield Equation 7. Differentiating Pa with respect to Q and setting the results to zero give ps = (1/2.86) pp.
This relationship means that to maximize available horsepower at the drill bit, the flow rate should be such that system losses should be about one third of surface pump pressure leaving two- thirds for downhole equipment (motor and bit). This setup may not always be possible since flow rate also depends on annular flow velocity requirements.
In general, when PDMs are not used, bit nozzle sizes are selected to utilize maximum hydraulic power for best bit cleaning. By inspection of Fig. 5 this is about 500 gpm. Analytically this flow rate (Equation 8) can be determined from Equation 7.6
When PDM's are used, part of the available energy is dedicated to the motor and part to bit nozzles. Part two of the series will focus on how to select and operate PDM's based on available horsepower and motor performance.
References
1. Tiraspolsky, W., "Hydraulic Downhole Drilling Motors," Houston: Gulf Publishing Co., 1985.
2. Sperry-Sun Co. Drilling Services, "Sun Drill Technical Information Handbook," 2nd Edition, Halliburton Energy Services Inc., 2000.
3. Cohen, J., Maurer, W., Evans, C., and Westcott, P., "High-Power Downhole Motor," Drilling Technology, American Society of Mechanical Engineers, Book No. H00920, Vol. 65 (1995), pp. 265-271.
4. Delpassand, M., "Stator Life of a Positive Displacement Down-hole Drilling Motor," ASME Energy Sources Technology Conference, Houston, Houston, Feb. 1-3, 1999.
5. Schuh, F., "Petroleum Engineer's Equations & Rules-of-Thumb: Drilling Equations," Dallas: Petroleum Engineer Publishing Co., 1977.
6. "Theory and Application of Drilling Fluid Hydraulics," Whittaker, A., ed., Boston: International Human Resources Development, 1985.
The authors
Kirk Lowe ([email protected]) is a graduate student at the University of Tennessee, Knoxville. Lowe holds a BS in mechanical engineering from University of Tennessee, Knoxville. He is a member of ASME.
Don W. Dareing (ddareing@ utk.edu) is a professor of mechanical engineering at the University of Tennessee, Knoxville. He has also served as engineering department head at the University of Tennessee and the University of Louisiana at Lafayette. Dareing's industry work included drilling and production research at Exxon Production Research Co., Houston, and field operations in the North Sea for Conoco North Sea Inc., London. He holds a BS and an MS from Oklahoma State University and a PhD from the University of Illinois, all in mechanical engineering. Dareing is a Life Fellow of ASME.
