Qatar Offshore—Conclusion: Corrosion modeling addresses sour operating conditions
Corrosion modeling for the Pearl GTL pipeline project was carried out using the Shell corrosion model, which includes laboratory and operating experience from Shell Canada Ltd., which has extensive operating experience with sour wet-gas fields with similar levels of CO2 and much higher levels of H2S.1
This second article in a two-part series provides details of the modeling used in determining the design of the pipeline project, moving from base case through the different variables involved to assessment of the tools and processes required to implement the chosen design.
The first part of the series (OGJ, Oct. 3, 2005, p.62) described the selection process used in choosing carbon steel with inhibition for the pipeline.
Base case
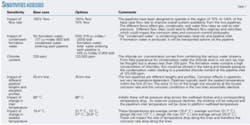
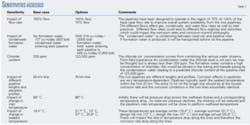
Table 1 shows the sensitivities assessed in the modeling study.
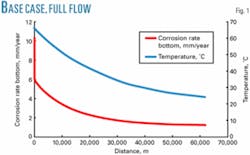
Fig. 1 shows the model output graphs for the corrosion rate on the bottom of the line and the temperature along the length of the pipeline. Factors common to the base case and most of the cases reviewed are:
• Dominant corrosion regime is H2S sour corrosion.
• Iron sulfide scales are not 100% protective even at low chloride levels, so that continuously injected corrosion inhibition (CI) is needed from the start of production.
• Inlet water will contain no dissolved Fe ions because corrosion resistant alloy (CRA) tubulars will be used downhole and upstream piping will be entirely CRAs. This water is described as “hungry water.” Corrosion rates are initially very high. As corrosion occurs, iron goes into solution and the concentration gradients and equilibria cause the corrosion rate to drop. If carbon steel tubulars were used downhole, this initial corrosion rate peak would not occur.
• The drop in corrosion rate with the drop in temperature is the dominant factor downstream of the inlet section
• Flow regime in the whole pipeline is annular dispersed for the base case. For corrosion control, annular dispersed flow is the preferable regime (having no top-of-line corrosion issues, no flow issues, corrosion equal across the circumference, and a very low risk of solids drop out and stagnant zones).
For the base case with no corrosion control, the maximum corrosion rate is 10.3 mm/year (Fig. 1). These modeled corrosion rates are similar to corrosion rates measured in the field by Shell Canada.
Kinetic hydrate inhibitor (KHI) is injected for hydrate control but only in the winter months when sea temperatures are below the hydrate temperature. Tests have not yet been carried out to assess the impact of KHI on the corrosion rate for this project. Previous testing on other projects, however, indicates that KHI is likely to have zero to a slightly beneficial effect on corrosion rate.
With corrosion inhibition the corrosion rate can be brought down to 0.1 mm/year.2 The overall corrosion rate will depend on inhibitor system availability, i.e., the uptime of the inhibition system.3
Flow rate
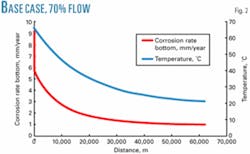
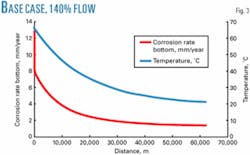
Each pipeline has been designed to operate at 70% to 140% of the base case flow rate to improve overall system availability from the two pipelines combined. The different flow rates affect gas, condensate, and water flow rates, as well as inlet pressure. Figs. 2 and 3 show the model outputs for 70% and 140%.
There are no significant differences between the 100% case and the 140% case (Table 2).The flow regimes are the same. The corrosion rate is slightly higher in the 140% case, but the 140% case can still be protected by CI.
The 70% case is in stratified wavy flow, compared with the 100% case which is in annular dispersed flow. For the 70% case, corrosion will be concentrated in the water layer at the bottom of the pipeline.
The water layer is about 13 mm deep. The water-wetted perimeter is 180 mm. The water cut should be only 1.6-2.3% over the entire pipeline.
For the 100% case in annular flow, corrosion will be distributed around the pipe circumference.
Although there is a change in location of the corrosion, there is no significant change in the maximum corrosion rate. The maximum corrosion for the 70% case is only marginally less than for the 100% case. Note that although the 70% case is in stratified flow, no top-of-line corrosion is expected.
Field experience shows that top-of-line corrosion is not a risk in sour service.
The requirement for operational pigging and batch inhibition is based on the risk of stagnant pools of high-chloride water (e.g., if formation water is produced) building up at low velocities and the (low) risk of under deposit corrosion (from solids drop out at low velocities). These factors are related to film velocity and liquid hold up. More frequent batching and operational pigging may be required for the 70% case than the 100% case.
Formation water
No offshore water separation is planned. If formation water is produced, it will be transported onshore via the pipelines and handled in the onshore water-treatment facilities.
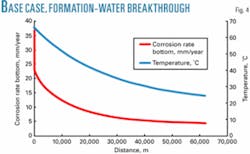
Formation water is expected to contain a high level of chlorides. Experience in existing sour wet-gas fields suggests that chloride levels greater than 10,000 ppm can cause a major problem by attacking the protective iron sulfide scales inside the pipeline. The uninhibited corrosion rate will increase from 10.3 mm/year with only condensed water in the pipeline (Fig. 1) to 36 mm/year if formation water breakthrough occurs. (Fig. 4).
This experience is incorporated into the corrosion model.
Once the critical threshold of chloride concentration has been reached, producing additional water has little impact on the corrosion rate. After this point the corrosion rate is relatively insensitive to either the chloride level or the water rate.
The proper corrosion-control program can still protect the line, even with this high uninhibited corrosion rate. Such corrosion rates will force the required inhibitor system availability to be close to 100%.
The high chloride level would increase the requirement for batch inhibition under certain conditions and thus increase the overall costs of corrosion control. High chloride levels may also lead to process problems (fouling, solids deposition) in the onshore plant (since high chloride levels typically indicate high calcium levels, which lead to scaling).
Length, elevation
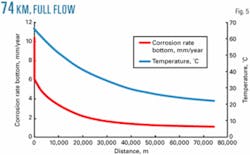
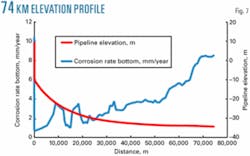
The two pipelines being installed are 62 km and 74 km. The base case examined the 62-km line. Fig. 5 shows the corrosion profile on the longer line. The maximum corrosion rate is the same as for the shorter pipeline.
The maximum corrosion rate in the line is at the pipeline inlet. Extending the line will have no impact on the maximum corrosion rate. Continuous inhibitor injection rate is based on the throughput of the line, not the surface area, so that increasing line length has no impact on inhibitor volumes used or costs.
One element of batch inhibitor volume, however, is related to the pipeline surface area. For the increase in pipeline length, the required batch volume per run would go up by 3%, increasing batching costs slightly.
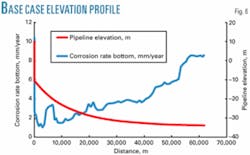
Figs. 6 and 7 show that the elevation profiles for the two lines are slightly different, but at anticipated flow rates the elevation profile has no impact on corrosion rates.
Inlet temperature
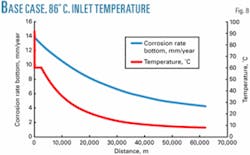
Initially there will be pressure drop across the wellhead chokes and a corresponding temperature drop, leading to pipeline inlet temperatures of 66° C. As reservoir pressure declines, the choking will be reduced and pipeline inlet temperatures will be close to the platform wellhead temperatures. The predicted end-of-life inlet temperatures are 86° C.
The graph of the corrosion rate at 86° C. inlet temperature (Fig. 8) is slightly different from the graph at 66° C. inlet temperature (Fig. 1). An 86° C. inlet temperature will cause some protection from high-temperature scales between 86° C. and 80° C., leading to a minor peak in the corrosion rate at 80° C.
This peak is lower than the peak at the inlet conditions (due to the “hungry water” condition) and therefore is not significant in determining the maximum corrosion rate in the line.
Where this peak does have an impact, however, is on corrosion-inhibitor selection. Corrosion-inhibitor performance is very temperature-dependant. Corrosion inhibitors are available that are effective at 86° C., but these will be more expensive, with fewer choices than if the maximum temperature is 66° C.
The inhibitor tests were carried out at 86° C.
Ambient temperature
The base case uses an average winter seabed temperature of 19.4° C. Other important temperatures are average summer seabed temperature, 31.7° C.; average annual seabed temperature, 25.6° C.; design-life minimum seabed temperature, 13° C.; design-life maximum seabed temperature, 37° C.
A change in ambient temperature has no effect on the maximum corrosion rate at the pipeline inlet; it will affect the rate of temperature drop along the line and thus the corrosion rate drop along the line. If the same corrosion allowance is used for the whole pipeline (based on maximum corrosion rate at the inlet), any of the shown ambient temperatures can be used. If there is a need to optimize the corrosion allowance along the pipelines, then the ambient temperature to be used needs to be carefully considered.
Table 3 shows data for the corrosion rate and temperature 10 km down the pipelines for each of the cases.
With corrosion control by inhibition, a long-term average corrosion rate is the important rate for assessing the required corrosion allowance and the inhibitor system’s availability (which are linked). The design-life minimum and maximum data points are, therefore, not important, as they will average out.
Also, the winter average and summer average are supplanted by the annual average temperature if production lifetime modeling is carried out.
Production life
The uninhibited corrosion rates in this system are very high; 10 mm/year at initial production and 36 mm/year if formation water is produced. The design corrosion rate has been based on the inhibitor availability approach, taking into account periods when the uninhibited corrosion rate applies and periods when the inhibited corrosion rate applies:2-4
CR = f x CRi + (1 - f) x CRu
Where: CR = the overall corrosion rate per year.
f = the fraction of time the inhibitor system is working, i.e. availability.
CRi = the inhibited corrosion rate.
CRu = the uninhibited corrosion rate.
With highly corrosive systems it is not uncommon to design the system based on 100% inhibitor availability and a small corrosion allowance to accommodate the inhibited corrosion rate. Thus, f = 1, and the required lifetime corrosion allowance, CA, over the design life, L, is:
CA = L x CRi = L x 0.1 mm/year
The reason for this approach is that, even with the maximum possible corrosion allowance (8 mm),2-3 the required f values would be very close to 100%, allowing little extra freedom of operation. By selecting 100% availability in the design, the uninhibited corrosion rate plays no part in this assessment.
The downside of this approach is that if the inhibitor system goes down, production has to be shut in. This is the approach that has been adopted in the basis for design:
• 3-mm corrosion allowance.
• 100% inhibitor system availability.
• Shut-in production if the inhibitor system goes down.
It is likely that a less strict regime can be adopted once an inhibitor has been selected and the inhibitor persistency has been assessed.
For a continuously injected corrosion inhibitor, persistency is usually not high-ranging from a few hours to an entire day; this may be sufficient to make the system easier to operate. There may also be the opportunity to optimize the availability-corrosion allowance as more comprehensive data become available.
Achieving 100%
Predicted uninhibited corrosion rates for the project are high (10-36 mm/year) and the design requires that the inhibition system have 100% availability. The consequence of this is that if the inhibition system goes down, production must be shut in from the originating platform.
In this event, additional production could be provided from the other platform, but a 60% loss of throughput for the onshore plant would still result. There is, therefore, a strong economic justification to ensure that 100% availability can be achieved.
The processes and tools required to achieve 100% availability include:
• Failure Modes and Effect Analysis (FMEA) of the corrosion-control system.
• Inhibitor-system design that includes 100% back up for the CI injection system.
• Inhibitor system availability assessment analysis.
• Selection of personnel, training, and competence assessment.
• Commissioning of all system components.
• Defining and agreeing roles and responsibilities and key performance indicators.
• Logistics, contracts, purchasing, and vendor participation to ensure delivery of products.
• Day-to-day attention to the details and assessment of availability, integrated with corrosion monitoring and inspection activities.
• Documentation of achieved availability and risk-based assessment of the systems.
• Corrosion-management system (which incorporates many of the activities described in the previous bullet points).
• Backup and controls for the corrosion-control system (the inhibition system, the corrosion-monitoring system, and the corrosion-management system).
One hundred percent availability allows no room for errors in the corrosion-control system. From field experience, 100% availability is achievable but requires high-standard inhibition systems, trained personnel, awareness, and focus on the corrosion risks. It also requires the willingness to shut in production if the inhibitor system goes down.
Acknowledgments
The author thanks Shell Global Solutions International BV, Amsterdam, Qatar Shell GTL, and Qatar Petroleum for permission to publish this work.✦
References
1. Pots, B.F.M., John, R.C., Rippon, I.J., Simon Thomas, M.J.J., Kapusta, S.D., Girgis, M., and Whitman, T., “Improvements on the De Waard - Milliams corrosion prediction and applications to corrosion management,” NACE Corrosion 2002, Paper No. 02235, Denver, Apr. 7-11, 2002.
2. Rippon, I.J., “Carbon steel pipeline corrosion engineering: life cycle approach,” NACE Corrosion 2001, Paper No. 01005, Houston, Mar. 11-16, 2001.
3. Rippon, I.J., “Corrosion control system availability management for reduced cost and extended life,” NACE Corrosion 2003, Paper No. 03313, San Diego, Mar. 16-21, 2003.
4. Kapusta, S.D., Pots, B.F.M., and Rippon, I.J., “The application of corrosion prediction models to the design and operation of pipelines,” NACE Corrosion 2004, Paper No. 04633, New Orleans, Mar. 28-Apr. 1, 2004.
