Single index measures operational performance of hydrocarbon facilities
A new method overcomes many of the limitations of existing hydrocarbons benchmarking practices and addresses the need for a single and precise measurement of operational performance that can be applied uniformly throughout the oil and gas industry.
The method describes the measurable properties (metrics) of an oil and gas facility (platform, pipeline, marine terminal, processing terminal, petrochemical plant, refinery, or LNG plant) and accounts for their interdependencies. It further calculates the percentage deviation of each metric relative to the corresponding industry (peer group) average and determines its significance.
Finally, the method integrates all the individual measures of performance into a mathematical equation to provide a numerical value of overall hydrocarbons competitiveness: the Juran Hydrocarbons Index.
No consistent method
Since the inception of the first competitive benchmarking study, initiated by Xerox Corp. in the late 1970s, and the following work of Robert C. Camp,1 benchmarking methods have continually evolved. The oil and gas industry has witnessed this development through the introduction of new approaches to benchmarking, wider variety of performance metrics, and different normalization procedures, all aiming to provide a more accurate and informative picture of performance.
Despite this progress, the industry has lacked a consistent and scientifically sound methodology for measuring overall operational performance, with a single numerical index. The outcomes of most benchmarking exercises have been a collection of key performance indicators (KPIs), identification of gaps for improvement, and recommendations based upon these gaps. Most of these practices, however, have failed to recognize the significance of interdependencies among metrics.
In addition, many of the benchmarking tools currently employed lack accuracy and offer only a partial picture of competitiveness. For example, most managers evaluate the performance of their oil and gas assets on the basis of the gap analysis, even though its purpose is to indicate improvement potential.
The reason for this is that the majority of the benchmarking studies concentrate their attention on one reference point, the best industry performer. This reference point, however, may not be the most appropriate measure of performance. It reflects the performance of only one benchmarked asset (or at most a few) whose value may not represent the industry.
In contrast, the performance can be measured relative to the industry average. This point is statistically more reliable because it considers the values of all participants and minimizes the effects of the outliers.
Similarly, the radar chart, a tool commonly used in benchmarking studies, reflects only the quartile distribution of performance metrics. While it provides a good visual presentation of performance in different business areas, it is unable to indicate actual overall competitiveness.
This is because it transforms variable data into discrete output by applying ranking techniques. As a result, the radar chart is incapable of precisely determining how much better or worse is an individual performance.
Given these limitations, Juran Institute was asked by its oil and gas customers (among others, BP PLC, Statoil ASA, Total, Pemex) to develop a methodology that provides a precise and accurate measurement. In particular, there would appear to be a need for an industry index of operational performance that can be applied consistently throughout the oil and gas industry, irrespective of the asset type being studied.
Moreover, the measurement should be “balanced”; it should include KPIs dealing with efficiency and effectiveness with enablers and results (similar to the Baldrige and EFQM Excellence Models).
JHI
To address these challenges, Juran Institute has developed a methodology that is expressed in the form of a single index, the Juran Hydrocarbons Index (JHI). This index is a cumulative indicator of the overall competitiveness of an asset, based upon efficiency and effectiveness of its performance. It is a numerical value representing the percentage deviation of performance, relative to the corresponding industry or peer group average.
For example, a particular asset with a JHI of 10 would indicate that its performance is 10% better than the average performer. A negative JHI indicates that the performance is worse than the average industry standard.
The spread of the index is not restricted by lower or upper limits (i.e., -100% to +100%). Nevertheless, extremely high deviations have not been observed due to the cumulative nature of the index.
Index structure
The JHI is built around a balanced model that is achieved by assigning equally all key performance indicators to efficiency and effectiveness variables. Statistically speaking, this implies that both types of variables have equal influence on the overall result, all other things being equal. A similar approach was used in the design of the Tonchev Performance Index, which Purdue University now uses to measure the performance of some 8,000 call centers worldwide.2
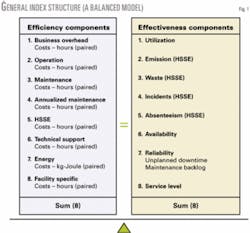
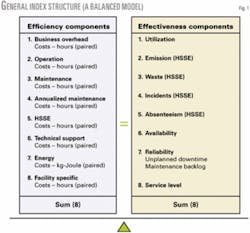
The metrics around which the JHI is constructed have been developed during the past 10 years in which Juran Institute has been benchmarking in the oil and gas industry. The model is designed, however, to be flexible to enable metrics to be added in the future, as long as the balance between efficiency and effectiveness is retained. Fig. 1 shows a visual representation of the index composition and the relationship between component metrics.
The efficiency element of the JHI consists of eight areas that are dually represented by 16 cost and hour KPIs. These include:
• Business overhead.
• Operations.
• Maintenance.
• Annualized maintenance.
• Health, safety, security, and environment (HSSE).
• Technical support.
• Energy.
• Facility-specific item consists of such activities as inspection (for pipelines), planning and scheduling (for marine terminals), and laboratory (for processing terminals). A “paired approach” is applied to these areas, which signifies that each of the eight business areas is evaluated not only on the basis of costs but also on man hours expended (with the exception of energy where instead of hours, use in kilogram-Joules is employed).
Considering man hours expended as well as costs provides a more precise estimation of efficiency and compensates for geographical variations in labor costs.
Similarly, the effectiveness element of the JHI embodies five areas of business performance, comprising a total of eight components:
• Utilization.
• HSSE (represented by four measures unrelated to costs and hours).
• Availability
• Reliability.
• Service.
Efficiency vs. effectiveness
One might wish to question the balance between efficiency and effectiveness seen in the JHI and the individual significance of each of the variables in the overall evaluation of performance. It may be argued, for example, that efficiency is more important in the hydrocarbons industry than effectiveness and therefore should be assigned a higher influence, and visa versa. Responding to this requires a closer look at both elements.
• Efficiency measures the degree to which an organization operates with a minimum consumption of resources. It reflects productivity and is expressed in terms of money, time, or effort expended. In the JHI, it is represented by a robust set of widely accepted cost and time metrics.
• Effectiveness, on the other hand, measures the degree to which an organization achieves its goals and meets the requirements of its stakeholders. It is results oriented and relates to process and product quality. In the JHI, effectiveness encompasses utilization, HS(S)E, availability, integrity, and reliability.
Few people would disagree that both of these elements are important to the industry. However, the question remains: What is the relative significance of each of them?
We have adopted the stance that each element has equal importance as oil and gas companies of today and tomorrow must not only be profitable but also customer oriented and socially responsible. The latter have long-term implications and encompass important issues including care for the environment, local communities, and worker safety.
It is our conviction that this balanced approach is appropriate as no assumptions are made regarding the superiority of one element over the other, and therefore any bias or subjectivity is removed. Nevertheless, should industry views change in the future, then supported by empirical data, the JHI can be easily adjusted to accommodate it.
Calculation
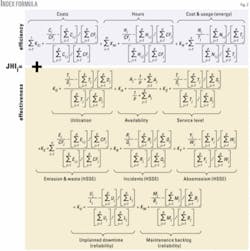
The formula presented in Fig. 2 reveals the elements and calculations which form the basis of the JHI.
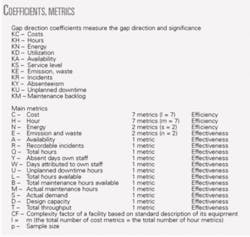
Essentially, the formula calculates the percentage deviation of each metric from the industry (peer group) average and then, having taken account of the gap coefficient for a particular metric, aggregates all formed values. (See accompanying box for coefficients and metrics.)
• Costs encompass all major operating expenditure (OPEX) costs normalized by complexity (CF):
-Business overheads.
-Operations.
-Maintenance.
-Annualized maintenance.
-Health, safety, security, and environment.
-Technical support.
-Facility specific (laboratory; inspection; planning and scheduling).
• KPIs related to hours have the same division as per-facility costs.
• Energy costs and use are normalized by total throughput.
• Utilization is calculated by dividing the total real throughput by the design capacity.
• Health, safety, security, and environment consist of:
-Emission: environmental impact units (gas flared and vented/CF).
-Waste: total waste by complexity (tonnes/CF).
-Incidents: total number of recordable incidents/million man-hours.
-Absenteeism: total own staff absenteeism (% of total days).
• Service level reflects the percentage of overall demand met.
• Availability is reflected in the number of hours that product movement has been restricted due to unavailability of equipment.
• Reliability is a sum of unplanned downtime (number of hours of unplanned downtime of a system divided by the total number of hours available) and maintenance backlog (number of maintenance hours in a system divided by the total number of maintenance hours available).
The structure of the JHI formula ensures a balanced model with equal significance attributed to efficiency and effectiveness of performance. The total number of efficiency business elements equals the total number of effectiveness components (eight), although the former consists of 16 paired comparators. Where applicable, metrics are normalized by asset complexity to reflect the individual differences between the facilities being benchmarked.
Finally, p represents the sample size, indicating the number of participating benchmark facilities used as a basis for the comparisons.
Significance of gap coefficients
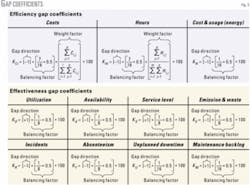
The gap coefficients represent an important element of the JHI in fine tuning the entire performance equation. Their main purpose is threefold: to determine the gap direction; to ensure the balance between efficiency and effectiveness; and to assign the weight of importance to each individual performance measurement. Fig. 3 provides the exact calculation of the gap coefficients.
It should be stressed that all metrics have a weight factor as a part of their gap coefficient. For some metrics, however, this is equal to one and therefore is not visible in the calculations. For the efficiency gap coefficients (except energy), the weight factors are calculated as weighted averages representing the proportional distribution of each metric in the total sum of cost/hours for a given sample.
Graphical presentation
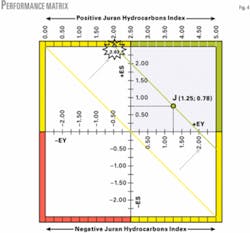
Fig. 4 presents the JHI on a performance matrix that consists of two axes (efficiency, EY; and effectiveness, ES) and four quadrants.
The quadrant border colors have a traffic-light association and indicate the level of performance (i.e., green-excellent; red-poor; and yellow-average). The yellow diagonal line signifies all combinations of EY and ES that are equal to the industry (peer group) overall performance.
The slope of the line is 45°, due to the index balance between the efficiency and effectiveness. This implies that 1% decrease in EY can be compensated by 1% increase in ES, and vice versa.
All combinations below the yellow diagonal line will indicate a performance below the industry average, whereas those above it will indicate above average performance. The upper right quadrant (light purple with green edges) is the desired area for a hydrocarbons asset to be, where both EY and ES are positive.
The matrix has two scales that measure the index score: positive (top) and negative (bottom). Point J is a typical example of a well-performing facility; confidentiality restrictions prohibit the identity of this facility. Its index score is 2.03 (i.e., intersection of the green line with the positive index scale).
To enable a more detailed analysis, the JHI can be further decomposed.
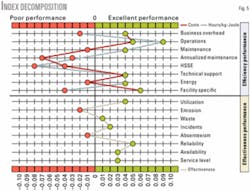
Fig. 5 provides an overview of the competitiveness within each business area. The figure pinpoints the weaknesses (red points), where improvements need to take place, and the strengths (green points), where a given company has a competitive edge. It is a performance dashboard that managers can use in pursuing their business objectives.
For example, it reveals that Company J is underperforming in the following efficiency areas: business overhead hours (2%); maintenance costs (1%); annualized maintenance costs (7%) and hours (3%); HS(S)E costs (8%) and hours (4%); energy costs (1%); and facility specific hours (4%). Similarly, its weaknesses in terms of effectiveness relate to emissions (2%) and absenteeism (1%).
Application
The JHI is designed to address the needs of the oil and gas industry in providing consistent performance measurement methodology. The index incorporates commonly used industry metrics and recognizes the interdependencies among them.
This is an holistic approach that is particularly relevant in the hydrocarbons sector, where the performance in a single business area (e.g., maintenance) taken in isolation may result in misleading conclusions unless a wider viewpoint of performance is considered, including issues such as sustained reliability, availability, and HSSE performance.
It is our view that the operational performance can be accurately determined only if all relevant performance metrics are aggregated in an integrated analytical approach rather than interpreted independently.
The nature of this approach also allows for a broad application. In this respect, the JHI has three levels of deployment: asset (facility or system), corporate, and industry-wide.
Considering first the application of the index to monitor the performance of a single facility, the index score (Fig. 4) and decomposition (Fig. 5) provide an assessment of the facility’s overall performance and a clear and unambiguous identification of its strengths and areas of noncompetitiveness.
In addition, the index helps to inform the balance between efficiency and effectiveness initiatives and may benefit managers by providing a tool for resource allocation.
At the corporate level, the JHI may be applied to all assets of a company throughout its value chain. The resultant overview of operational performance across the entire asset base is of obvious benefit to senior management. Scores can indicate performance per business area and asset type, thereby offering significant insight into asset performance and enhancing the monitoring and control of operations at a corporate level.
This will in turn input to improvement initiatives by identifying the problem areas, highlighting the best practices within and outside the organization, and indicating appropriate training requirements.
The third application of the index lies in its application to longitudinal analyses to assess industry performance year-upon-year based upon changes in industry averages. Clearly, the potential beneficiaries of such an analysis include a wider spectrum of professionals within the oil and gas industry.
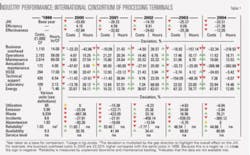
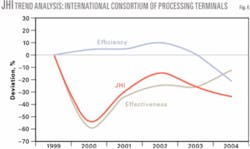
Table 1 provides an example showing the annual performance of a large international consortium of processing terminals (25 gas and liquid processing plants across Europe, the US, Middle East, and Asia).
The figure indicates that, despite the gains in efficiency between 2000 and 2003, the overall performance of the consortium did not improve in this period (the JHI scores being negative for each year), owing to a decrease in effectiveness that was greater than the gains in the efficiency. Similarly, the consortium performance in 2004 was negative in both efficiency and effectiveness areas. Nevertheless, the effectiveness performance showed signs of improvement in 2004.
Closer inspection of the effectiveness element reveals that utilization incidents and absenteeism have negatively affected the overall effectiveness performance. Waste and emissions also had for a negative impact in 2000 and 2001 but improved in 2002, 2003, and 2004. The only elements of effectiveness to improve over the time period were availability and reliability (except in 2002).
In parallel, overall efficiency was positive between 2000 and 2003 due to the dual reductions (costs and hours) in the operation, maintenance, energy, and laboratory activities but decreased in 2004. Business overhead and annualized maintenance performances imposed a negative effect during the entire 5-year period.
Fig. 6 clearly shows the trend of JHI dynamics during the time span studied.
Finally, the JHI can serve as criterion for identifying and evaluating best-performing companies, whose efficiency and effectiveness measures are both above their respective industry averages. While there is an abundance of other evaluation approaches, such as the Malcolm Baldrige Award, European Foundation of Quality Management (EFQM), ISO 9000, and the Deming Award in Japan, each of these is very generic by nature.
In contrast, the JHI is unique because it is tailored exclusively for the oil and gas industry, has a narrower scope (operational performance only), and by virtue of its use of quantitative data has a very low level of subjectivity. In this respect, the index can be applied independently or in parallel to the existing evaluation approaches.
Given its characteristics and application, the JHI can be a valuable addition in the portfolio of tools available to monitor, control, and improve operational performance. It is a methodology that can help accelerate the on-going industry pursuit of business excellence.
Calculation for example
Following is a step-by-step computation for the complete JHI calculation for the industry example presented in Table 1 and Fig. 6.
1. A base-year selection. Year 1999 is selected as a point of reference so that subsequent yearly performances can be measured. The time span of the analysis is 6 years, from 1999 to 2004.
2. Industry average values. The industry average values for each KPI for a given year are calculated by taking the individual values of all participants in this year. Table 2 provides a summary of all average numbers used in the JHI calculation.
3. Percentage deviations. The percentage deviation for each performance area (KPI) is calculated as a ratio with a numerator expressing the difference between the current-year and the base-year average performance and a denominator representing the base-year average performance.
For example, the percentage deviation of “Business Overhead” in 2004 is equal to: (1,469 - 1,110)/1,110 = 0.3234 = 32.34%. (See Table 2.) The deviation calculations of all other KPIs are analogical.
4. Gap coefficients. As stated, the gap coefficients consist of three parts: a gap direction, a balancing factor, and a weight factor. Fig. 3 provides the exact computation of the gap directions and the balancing factors; the diagram also reveales the general formula for the weight factors.
Table 3 presents the exact values of the applied weight factors, whereas Table 4 displays the total values of the gap coefficients.
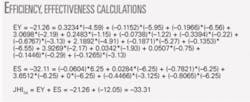
5. Efficiency and effectiveness scores. The efficiency and effectiveness scores are aggregations of all corresponding KPI deviations multiplied by their gap coefficients. For example, the efficiency and effectiveness scores in 2004 can be calculated as shown in the accompanying box.
6. Overall JHI score. The overall JHI score is a summation of efficiency and effectiveness scores. To complete the example, the JHI value for year 2004 (JHI04) is a result of the third calculation in the accompanying box.
The JHI for year 2000, 2001, 2002, and 2003 are calculated in the exact same fashion. ✦
References
1. Camp, R., Benchmarking: The Search For Industry Best Practices That Lead To Superior Performance; Milwaukee: ASQC Quality Press, 1989.
2. Tonchev, A., Tonchev, C., Tonchev Performance Index, CCDQ; West Lafayette, Ind.: Purdue University, 2001.
The authors
Angel Tonchev (atonchev @juran.com) is a senior consultant at Juran Institute. He has 5 years of benchmarking experience in a variety of industries including oil and gas, procurement, information technologies, and call centers. He is co-developer of the current JHI and the Tonchev Performance Index. Tonchev holds a master’s degree in economics from Maastricht University, the Netherlands.
Christo Tonchev (ctonchev @juran.com) is a senior consultant at Juran Institute. He has 5 years of benchmarking experience in a variety of industries including oil and gas, procurement, information technologies, and call centers. He is a co-developer of the current JHI and the Tonchev Performance Index. Tonchev holds a master’s degree in economics from Maastricht University, the Netherlands.
