Study assesses thermomechanical buckling in shore-approach pipelines
Shallow and insufficient soil support may lead to upheaval buckling of heated pipelines in shore approach areas.
This article presents a numerical model to simulate the thermomechanical buckling of buried heated pipelines in shore approach areas. An analysis adopting geometrical, physical, and operational data is also carried out for a particular Petrobras project, taking in situ geophysical survey, geotechnical, and oceanographic information into account. The discussion also addresses the influence of the sediment transport after the opening of the trench and required backfilling with a heavier soil.
Progress in modeling
Analytical and numerical modeling of the upheaval buckling response of pipelines has progressed rapidly over the last few years; from the classical analysis1 2 to one including large pipe displacement and associated cover non-linearity.
Technical requirements can considerably affect the economic viability of rigid pipeline projects.
Petrobras is involved in a large number of heated pipeline projects with shore approaches and typically uses conventional techniques for pipeline burial. Alternative horizontal directional drilling technology is expensive and immature as a means of pipeline burial.
The movement of sediments on the seabed, induced by marine currents and waves, may partially and sometimes totally uncover a pipeline. This is undesirable technically, operationally, and environmentally. Additionally, there is concern regarding the thermomechanical instability of heated pipelines due mainly to the uncertainties in soil modeling.
Pipeline burial should be optimized to achieve the smallest number of trenching and backfilling passes required to obtain the minimum depth needed for structural integrity.
In the pipeline trenching, positioning, and burial processes, both natural backfilling and automated backfilling (using soil disturbed by opening the trench) should be considered.
In heated pipeline designs in shore approach areas, even the combination of these backfills is sometimes not enough to ensure pipeline cover during design life.
Sediment movement can partially, and sometimes totally, uncover a pipeline, compromising its stability, and possibly, its structural integrity.
We have designed a methodology for upheaval buckling analysis in export pipelines, establishing a maximum allowable imperfection height for the buried pipeline’s offshore section and carrying out a parametric study to assess the influence of the imperfection height, shape, and operating temperature on the burial depth required to avoid upheaval buckling (OGJ, Aug. 16, 2004, p. 66).3
In this article, a sensitivity analysis is carried out to evaluate pipeline displacements subjected to temperature and pressure maximum variation in the shore approach area. This analysis considers sediment movement in this area, modeling the trench backfilling in the pipeline burial operation with different soil types: undisturbed clay (natural or intact), disturbed clay (disaggregated or remolded), and sand.
The layering of these soils is also analyzed.
Beach profile modeling
Pipeline shore approach design, including pipe burial specifications, presents great complexity due to comparatively (in relation to deeper waters) harsh environmental conditions and highly dynamic interaction between waves, currents, and sediment transport.
Sediment transport in the nearshore zone has been studied by focusing on longshore and cross-shore components separately. If a particular beach is sufficiently far from structures, inlets, and river mouths, it may be appropriate to neglect long shore transport as a first approximation.4 In this case, cross-shore transport will determine the change in beach profile contours according to local waves, sediment characteristics, profile shape, and variations in sea level.
Identification of the principal physical mechanisms that determine beach profile change has led to development of numerical models, such as SBEACH, that attempt to predict storm-induced beach profile evolution, including the formation and movement of such major morphological features as long shore bars, troughs, and berms under varying storm waves and water levels.
SBEACH is not intended for use in long-term analysis of cross-shore transport in which hydrodynamic forces other than breaking waves and water level may be factors. It is intended only to predict and analyze short term, storm-induced erosion.
Nevertheless, environmental data for this particular pipeline region were used to simulate storm-induced beach profile change with SBEACH in order to obtain an initial estimate regarding pipeline burial-depth specification.
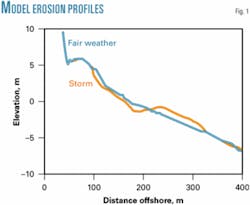
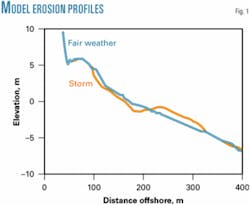
Out of the seven profile measurements available along the pipeline axis, three were chosen for closer evaluation because they included surf-zone measurements made with a sled to connect the land topography with the underwater bathymetry that extended up to 11m in depth. The profile (fair weather) that was chosen for the model runs is assumed to be the closest to the equilibrium profile for the beach when compared to another profile (storm) that is indicative of post-storm conditions (Fig. 1).
Sediment samples were not collected simultaneously with the profile measurements, but the sediment properties of the top layer of geotechnical cores taken along the pipeline axis were used. Since SBEACH only permits one value of median grain diameter along the entire profile, a value for fine sand was chosen as fairly representative of the upper reach of the beach where a lot of the erosion takes place and, theoretically, conservative if considered in the surf zone.
Simulations were carried out for minimum and maximum tidal amplitude (astronomical plus storm surge) assumed to be on the order of 0.5 to 2.3 m, respectively. Mean sea level was assumed to be 0.8 m. Wave conditions for 1, 10, and 100-year events, coming from the normal direction and up to a 45º angle with the beach, were considered for the simulations, although design wave conditions for the pipelines were actually for waves with direction normal to the pipe axis with slightly larger heights and longer periods.
Analysis of the joint distribution of significant wave height Hs and zero upcrossing period Tz in the pipeline region shows that 40% of all sea states have Hs between 0.8 and 1.6 m and Tz between 5 and 7 sec.
Although waves with periods and heights in these intervals are not considered storm conditions, they were simulated because they can cause more erosion nearer the shore than the larger waves because the latter break further offshore.
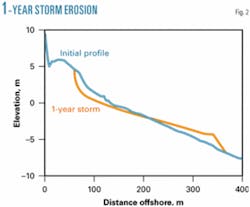
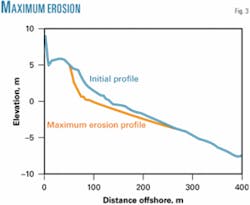
Fig. 2 shows the initial and final profile for simulation of a storm with 1-year return period conditions using SBEACH. Fig. 3 shows the maximum erosion profile, which consists of the line connecting depths due to maximum erosion at each point during all model runs (26 different storms conditions were simulated). The maximum erosion profile may be used as a reference for the determination of a pipeline burial depth which will permit the pipeline to be buried at practically all times.
Thermomechanical analysis
Prior to this test, an analytical-numerical model was developed to simulate thermomechanical buckling of buried, heated pipelines in shore-approach areas. An analysis adopting geometric parameters and operational data of a specific Petrobras design was carried out, in addition to a geophysical survey, and the gathering of geotechnical and oceanographic in situ data.
Backfilling with a heavier soil offering a larger resistance to the pipeline movement was considered. The model focused on the thermal buckling analysis of buried pipelines with different soils covering them and their possible vertical and axial movements during operation.
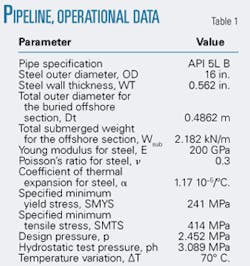
Table 1 presents geometric and material data for the steel pipeline, based mainly on the mechanical design and hydrodynamic stability analysis, and the main operational data to ensure a perfect flow and optimize the oil pump rates.
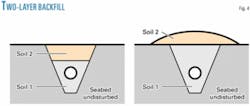
A two-overlay scenario is considered. The first layer precedes the sediment movement and probably consists of sand or disturbed soil removed in the trenching operation. The second layer consists of an imported soil, required to ensure the pipeline’s thermomechanical stability (Fig. 4).
Based on the geotechnical survey assessment carried out along the pipeline’s preliminary routes in the shore-approach area, undisturbed clay, disturbed clay, and sand were selected for the thermomechanical analysis (Table 2).
Sensitivity analysis
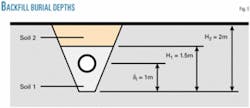
A sensitivity analysis evaluated results regarding the pipeline burial. The analysis considered the three soil types presented in Table 2 separately (Cases 1, 2, and 3) as well as combinations of these (Cases 4 and 5) where δi is the initial geometric imperfection height of the pipeline and H1 and H2 are the depths of Soils 1 and 2, respectively (Fig. 4).
In the sensitivity analysis, the initial geometric imperfection of the pipeline (out-of-straightness or prop) was fixed at 1%. In other words, an initial out-of-straightness height of δi = 1 m and an associated wave half-length of Li = 100 m. A total trench depth of H = 2 m was in place for all the studied cases.
For the cases with coupled covering, Soil 1 originated from sediment movement, with a trench backfilling depth of H1 = 1.5 m, while Soil 2 was the result of backfilling, with a depth of H2 = 0.5 m. To appropriately accomplish this sensitivity analysis, it was assumed that the soil characteristics originating from trench mechanical backfilling were equivalent to characteristics of the undisturbed clay.
Analytical-numerical model
Before the analysis was run, the soil reactions were calculated for the different cases, based on the model of American Society of Civil Engineers’ Guidelines of the Seismic Design of Oil and Gas Pipeline Systems (Table 3).5
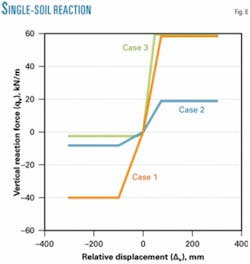
The soil reaction curves to the pipeline’s upward movement for Cases 1, 2, and 3 directly follow the model of the ASCE guidelines. For Cases 4 and 5, with coupled soil layers on the pipeline, the reaction curves of each soil that composes the covering were calculated in the same way, and equivalent reaction springs were developed numerically to model the phenomenon.
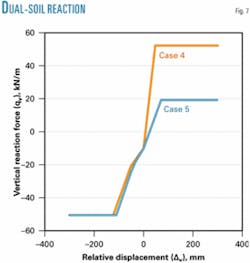
The equivalent soil reaction to the pipeline upward movement presents different stages. In a first stage, the equivalent reaction force (Q1eq) is limited by the maximum reaction force of the less stiff soil (Soil 1), where q1 is the maximum vertical Soil 1 reaction force per unit length of pipeline (as in Equation 1, see equation box).
The equivalent relative displacement (∆1eq) in this first level is calculated considering springs in series (Equation 2), where q2 is the maximum vertical Soil 2 reaction force per unit length of pipeline, and 1 and 2 are Soil’s 1 and 2 relative displacement, respectively.
In a second stage, Soil 1 presents a constant rigidity, represented by the pipeline’s resistance to vertical movement, q1. Conservatively, it is assumed that this force is constant until a deformation or relative displacement of the equivalent soil (∆2eq) equal to 10% of the Soil 1 covering depth occurs (Equation 3).
Because large soil displacements are not treated in this paper, the soil’s equivalent reaction force (Q2eq) is shown in Equation 4.
Following development, Soil 1 loses its resistance and the soil’s equivalent reaction force (Q3eq) becomes that shown in Equation 5.
Finally, the equivalent relative displacement associated at this third stage only corresponds to the resistance imposed by Soil 2 (Equation 6).
The relationship between maximum reaction forces to the downward and upward motions of the pipeline per unit length and the relative displacement for Cases 1, 2, and 3 are presented in Fig. 6; for Cases 4 and 5, in Fig. 7.
Thermomechanical buckling is an instability phenomenon, and it is essential to use a finite-element formulation that properly allows for the effects of changing geometry on the internal forces. In particular, the force resulting from internal pressure on the pipe when it bends needs to be examined.
ABAQUS v.6.4 software was employed in the analysis, with the pipeline modeled by a fine uniform mesh of linear pipe elements.6 An initial out-of-straightness was applied to allow a post buckling load-displacement analysis. The finite-element modeling simulated the pipeline during operation, with pressure and temperature maximum variation imposed after installation and initial out-of-straightness.
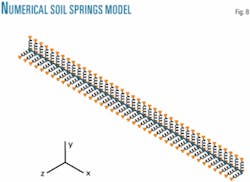
The pipe-soil interaction behavior is modeled by spring elements. This modeling employs the constitutive model of the ASCE guidelines to calculate soil reaction curves, i.e., the soil reaction force-relative displacement relationship (Fig. 8).
A comparison between the known analytical models developed by Maltby and Calladine and a simplified model in finite elements validated some parametrics of the numerical model.7 8 The parametric study presented by Solano completes the parameter analysis (initial geometric imperfection geometry, burial height, and stresses developed in the pipeline).
Finally, a complete numerical model for the thermomechanical analysis of buried heated pipeline in the shore approach areas was developed, using the methodology developed and adopted by a Petrobras engineers group for similar analysis, based mainly on the works of Solano, Benjamin, Cardoso, and Júnior.9-11
Analysis
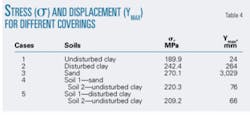
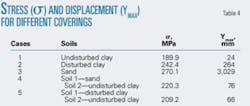
Table 4 presents the results of the von Mises stress and maximum vertical displacement that occurred in the pipeline geometric imperfection top, for the different coverings analyzed.
Two results in particular deserve to be noted:
• For the trench totally covered only by the specified sand (Case 3), the pipeline moves and consequently reaches strains beyond the established limits of displacement-controlled criteria. The displacement is so large that the pipeline surfaces.
• For the double covering consisting of disturbed and undisturbed clays (Case 5), the von Mises stress reaches a value below 90% of the SMYS, and the pipeline moves moderately, given a 70° C. temperature variation. Stress calculations based on the maximum allowable stress of 90% SMYS for von Mises stress are verified by Offshore Standard DNV-OS-F101, 2000, using the maximum utility factor 0.90 to load controlled criteria.12
Fig. 9 presents the von Mises stress, at the point of largest stress in the pipeline, which occurs at the middle of the geometric imperfection, as a function of the temperature variation for Cases 1, 2, 4, and 5.
Figs. 9-12 do not present the results for Case 3 (simple sand covering) due to the great magnitude of values obtained (Table 4), which would hinder depiction of the other results.
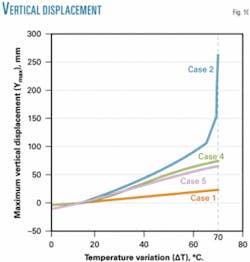
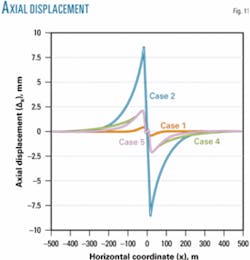
Figs. 10 and 11, respectively, present the results for maximum vertical displacement in the pipeline as a function of temperature, and axial displacement in the pipeline as a function of the horizontal coordinate for the maximum temperature variation (70° C.). These occur at the middle and extremes of the pipeline feed-in length, respectively (approximately 200-1,000 m, depending on the case).
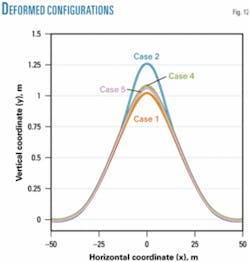
Fig. 12 also presents the deformed configurations for Cases 1, 2, 4, and 5 for a 70° C. temperature variation. When covered with disturbed clay, the pipeline deforms considerably. The soil considered in Cases 4 and 5, with the same characteristics of the undisturbed clay, offers larger resistance to the pipeline’s upward vertical movement, limiting larger deformations.
Acknowledgments
The authors thank Petrobras for sponsoring this work and giving permission to publish this article. The authors also acknowledge the support of the Federal University of Rio de Janeiro for this work. ✦
References
1. Hobbs, R.E., “In-service Buckling of Heated Pipelines,” Journal of Transportation Engineering, Vol. 110 (1984), No. 2, pp. 175-189.
2. Hobbs, R.E., and Liang, F., “Thermal Buckling of Pipelines Closed to Restraints,” International Conference on Offshore Mechanics and Arctic Engineering, Vol. 5 (1989), pp. 121-127.
3. Solano, R.F., Azevedo, F.B., Vaz, M.A., and Cardoso, C.O., “Design and Installation of Buried Heated Pipelines at the Capixaba North Terminal Offshore Brazil,” International Conference on Offshore Mechanics and Arctic Engineering,Vancouver, June 20-24, 2004.
4. Larson, M., and Kraus, N.G., “SBEACH: Numerical Model for simulating storm-induced beach change,” Technical Report CERC-89-9, 1989.
5. “Guidelines of the Seismic Design of Oil and Gas Pipeline Systems,” ASCE, 2001, American Lifelines Alliance, Appendix B, pp. 68-76.
6. ABAQUS Inc., 2003, “Abaqus Standard User’s Manual,” Version 6.4.
7. Maltby, T.C., and Calladine, C.R., “An Investigation into Upheaval Buckling of Buried Pipelines - I. Experimental Apparatus and some Observations,” International Journal of Mechanics Science, Vol. 37 (1995), No. 9, pp. 943-963.
8. Maltby, T.C., and Calladine, C.R., “An Investigation into Upheaval Buckling of Buried Pipelines - II. Theory and Analysis of Experimental Observations,” International Journal of Mechanics Science, Vol. 37 (1995), No. 9, pp. 965-983.
9. Benjamin, A.C., and Andrade, E.Q., “Flambagem Lateral de Dutos Aquecidos: Um Método Analítico Clássico Revisado,” 3rd Seminário de Dutos, IBP, Rio de Janeiro, Brasil, Rio de Janeiro, November 2001.
10. Cardoso, C.O., Costa, A.M., Andueza, A., and Amaral, C.S., “Finite Element Modeling of Coupled Global and Local Buckling of Heat Pipelines in Soft Clay,” 3rd Rio Pipeline Conference & Exposition, Rio de Janeiro, Oct. 22-24, 2003.
11. Junior, E.P., Costa, A.M., Amaral, C.S., Rocha, R.S., Guimarães G.B., and Souza, P.F., “Ensaio Experimental e Modelagem Numérica em Modelo Reduzido com Semelhança Física do Duto com Geometria Zigzag da Baía de Guanabara (PE-3),” 3rd Rio Pipeline Conference & Exposition, Rio de Janeiro, Oct. 22-24, 2003.
12. “Submarine Pipeline Systems,” Offshore Standard DNV-OS-F101, 2000, Det Norske Veritas.
Based on presentation to the International Conference on Offshore Mechanics and Arctic Engineering (OMAE 2005), Halkidiki, Greece, June 12-17, 2005.
The authors
Rafael Familiar Solano ([email protected]) is pipeline engineer at Petrobras, Rio de Janeiro. He holds a bachelor’s degree in mechanical engineering (1997) and an MS and a doctorate in ocean engineering (2001, 2005) all from the Federal University of Rio de Janeiro.
Murilo Augusto Vaz ([email protected]) is an associate professor at the Federal University of Rio de Janeiro. He holds a bachelor’s degree in naval architecture and marine engineering (1985) and an MS in ocean engineering (1990) from the Federal University of Rio de Janeiro, as well as a PhD from University College in London.
Valéria Souza Rego ([email protected]) is an oceanographer at Petrobras, Rio de Janeiro. She holds a bachelor’s degree in oceanography (1988) from State University of Rio de Janeiro and both MS and doctorate degrees in ocean engineering (1992, 1999) from the Federal University of Rio de Janeiro.
