Analysis estimates sulfuric acid emissions from FCCU wet gas scrubbers
A new analysis of data collected from various field tests allows more accurate estimations of sulfuric acid emissions from FCC units equipped with wet gas scrubbers.
FCC units are potential sources of H2SO4 emissions; we previously published a general guidance for estimating these emissions (OGJ, Feb. 9, 2004, p. 48). This earlier work included an emission factor for units with a wet gas scrubber, but it was derived from limited data.
Since then, we discovered 47 additional test results for the flue gas from FCC unit wet gas scrubbers. Our analysis, based on a review of these results, is a much more accurate representation of H2SO4 concentrations than the default factor published in 2004.
Sulfuric acid emissions
Sulfur oxides (SOx) are generated in combustion devices from the oxidation of sulfur contained in the fuel. SOx emissions from combustion devices are predominantly SO2 and a small portion of this SO2 further oxidizes to SO3. Within certain temperature ranges, SO3 readily reacts with water vapor to form H2SO4.
Some regulatory agencies require that companies report H2SO4 emissions. In the US, the Emergency Planning and Community Right-to-Know Act of 1986 (EPCRA) requires facilities manufacturing, processing, or otherwise using listed toxic chemicals above specific threshold quantities to report the environmental release of those chemicals annually.1 Sulfuric acid in any airborne form is on this list.
One can obtain the amount of SO2 formed from calculating a mass balance from fuel sulfur or from stack monitoring and testing. SO3 to H2SO4 conversion is calculated based on a process model.
This article focuses on the expected H2SO4 emissions from FCC units with wet gas scrubbers for particulate and SOx control.
Background
In June 1995, US Environmental Protection Agency modified the guidance for sulfuric acid reporting requirements by deleting nonaerosol forms of sulfuric acid under section 313 of EPCRA. "Aerosol" forms are defined rather broadly, however, in the current listing.
Subsequently, in November 1997, EPA issued Guidance for Reporting Sulfuric Acid, which discusses sulfuric acid emissions from industrial sources.2 This guidance was updated in March 1998.
The 1997 EPA guidance stated that the combined SO3 and H2SO4 produced from combustion sources is about 1-3% of the total SOx. The guidance implies that this conversion applies to all fuels, irrespective of the types of combustion devices or sulfur content.
We published an emissions estimating guidance, which showed that SO2 to SO3 conversion is affected by both fuel type and sulfur content (OGJ, Sept. 30, 2002, p. 78).
Papers focused mainly on SOx control options have reported limited data on the expected conversion of SO2 to SO3 for FCC units.
An early attempt to model the equilibrium found that SO3 concentration increases rapidly at higher oxygen inputs (OGJ, Feb. 23, 1981, p. 55). These authors found conversion of about 1% of the SO2 to SO3 for uncontrolled units based on flue gas composition measurements.
Byrne, in a study for developing catalysts for desulfurization, proposed typical conversion numbers for sulfur.3 Byrne recommended assuming that 5% of the feed sulfur was deposited on the catalyst and subsequently burned off in the regenerator. The recommended assumption for a relative ratio of SO2 to SO3 in the flue gas was 9:1, equating to a 10% conversion. The author, however, included no data to support these proposed assumptions.
Similar assumptions were repeated in subsequent papers, but supporting flue gas measurements were still not reported.4 5
In our 2004 article, we provided an equation to predict the conversion of SO2 to SO3 for FCC units without emission controls. We recommended that facilities equipped with a wet gas scrubber to control particulate and SOx emissions use stack measurements to determine H2SO4 emissions.
In the absence of stack tests, we suggested using 4.6% of the measured scrubber outlet SO2 as the estimated SO3 emissions. This was based on limited stack tests at one location. We derived the factor from six Method 8 samples taken on 2 days about 6 months apart. The measured conversion to SO3 was about 2-8% with scrubber outlet SO2 concentrations of 15-37 ppm (vol).
We had insufficient data to determine confidently if there is any trend in SO3 conversion with feed sulfur. Due to the limited data and concerns about the reliability of Method 8, we recommended that site-specific source test data would likely provide a more representative estimate.
Since early 2004, we discovered a total of 47 additional test results on the flue gas from FCC unit wet gas scrubbers. Our analysis, based on a review of these results, is a much more accurate representation of H2SO4 concentrations than the default factor published in 2004.
Sulfuric acid formation
When a sulfur-bearing fuel is burned, essentially all of the sulfur initially converts to SO2, which is the primary form of sulfur emissions from combustion equipment.
Although SO2 has a strong tendency to react with oxygen to form SO3 thermodynamically, the reaction rate is slow in the gas phase under normal conditions. Once SO3 forms, however, it readily converts to H2SO4 (within milliseconds) at normal humidities and in certain temperature ranges. Determining the conversion of SO2 to SO3 is therefore critical when estimating H2SO4 formation from FCC units.
The chain reaction occurs as follows:
S + O2-> SO2
SO2+ 1/2O2 <-> SO3
SO3 + H2O <-> H2SO4
The conversion from SO2 to SO3 during the combustion process appears to be a complex function of fuel type, sulfur content, excess oxygen, flue gas temperature, the catalytic effect of fuel contained trace metals (vanadium, sodium, etc.), and the type of combustion unit.
H2SO4 measurements
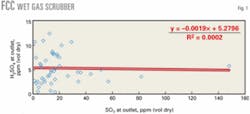
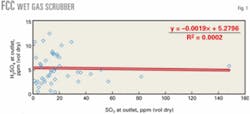
We obtained a significant number of H2SO4 measurements from the outlets of wet gas scrubbers on FCC units. Fig. 1 shows the concentration measurements as a function of SO2 with one outlier at 38.1 ppm (vol) removed.
Because our previous work indicated a strong correlation of H2SO4 with SO2, our first assumption was that this relationship would be applicable to the new data. There is significant scatter in the data, however, especially at the lower SO2 concentrations.
A statistical analysis showed that there was, in fact, no correlation with SO2. The average concentration of H2SO4 is about 5.3 ppm (vol dry) with only a slight downward trend with SO2 concentration. One can use a concentration of 5.3 ppm (vol dry), therefore, for estimating emissions if stack tests are not available.
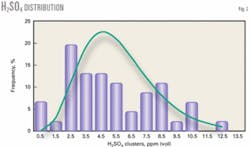
Fig. 2 shows the distribution of data within H2SO4 concentration clusters. This plot shows that 90.3% of the H2SO4 histogram (outlier at 38.1 ppm deleted) is less than 10 ppm (vol) H2SO4 and also that 90.8% of the cube root normal distribution is less than 10 ppm (vol) H2SO4.
The cube root normal distribution achieves a skewed distribution that matches the data well by taking the cube root of each data value and applying a normal distribution to the transformed data.
The statistical distribution for the H2SO4 data has a positive skew. To determine the appropriate transformation of the data, we used the Univariate procedure from SAS Institute Inc., Cary, NC, to test for the normality of the untransformed data and three common transforms: the square root, the cube root, and logarithm.
The square root and cube root both showed adequate fit to the normal transformation using statistical tests at all reasonable levels of significance. We chose the cube root transformation because its distribution of the interquartile data was more symmetric than the square-root transformation.
Probability of emissions performance
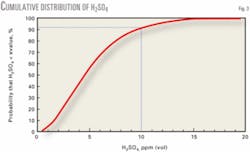
Fig. 3 shows the likelihood that a H2SO4 concentration will be less than a specified value. For example, the probability that the concentration will be less than 10 ppm (vol dry) is 90.8%.
To calculate the curve in Fig. 3, we computed the mean (1.66266) and standard deviation (0.36983) of the cube root of the H2SO4 data. We then computed the cumulative normal distribution function of the cube root of the H2SO4 data from 0.5 to 19.5 using the mean and standard deviation, plotting the function values against the H2SO4 data.
Fig. 3 shows that only one reading in 10 will exceed 10 ppm, only one reading in 20 will exceed 12 ppm, and only one in 100 will exceed 16 ppm.
These predictions apply to the population typified by the data set we analyzed. For example, all the H2SO4 data were collected under test conditions, which are typically steady-state operating conditions. Under other extreme conditions, such as start-up operations, the distribution of Fig. 3 may not apply.
References
1. "Sulfuric Acid: Toxic Chemical Release Reporting: Community Right-to-Know," Final Rule, 60 FR 34182, US Environmental Protection Agency, Washington DC, June 30, 1995.
2. "Emergency Planning and Community Right-to-Know Act - Section 313, Guidance for Reporting Sulfuric Acid (acid aerosols including mists, vapors, gas, fog, and other air borne forms of any particle size)," EPA-745-R-97-007, US Environmental Protection Agency, Washington DC, November 1997, updated March 1998.
3. Byrne, J.W., "New Developments in FCC SOx Catalyst Technology," presented to the NPRA Annual Meeting, paper AM-84-55, Mar. 25-27, 1984, San Antonio.
4. Wall, J.D., "Control FCC SOx Emissions," Hydrocarbon Processing, October 1984, pp. 45-46.
5. Evans, M., "SOx Reduction," Hydrocarbon Engineering, January 2003, pp. 43-44.
The authors
W.X. Nie is a senior engineer with ExxonMobil Research & Engineering Co., Fairfax, Va. He is involved currently in emissions releases estimates and control system recommendations. Before joining ExxonMobil, Nie spent 3 years as an energy engineer in the pulp and paper industry. He holds a BS in chemical engineering from Tsinghua University, China, and a PhD in chemical engineering from the University of Manchester, UK.
G. Shea is a senior engineering associate with ExxonMobil Research & Engineering Co., Fairfax, Va., where he serves as statistical consultant to ExxonMobil downstream affiliates. He joined ExxonMobil more than 20 years ago after serving for 5 years as a mathematics professor at the University of Texas, Austin. He holds an AB in philosophy from St. Louis University, an MSc in mathematics from the University of Ottawa, and a PhD in applied mathematics from Cornell University, Ithaca, NY.
T.P. Yarnick is a senior environmental advisor with ExxonMobil Refining & Supply Co., Houston, where he supports ExxonMobil's petroleum and chemical manufacturing businesses. He has more than 25 years' experience with ExxonMobil in the environmental and regulatory compliance arena. Yarnick currently leads a water and waste team responsible for regulatory advocacy at the federal level, and provides compliance support to operating facilities. He holds a BS in environmental biology from the University of Pittsburgh.
J.H. Siegell is a senior engineering associate with ExxonMobil Research & Engineering Co., Fairfax, Va., where he heads activities on estimating and controlling air toxic, hydrocarbon, and odorous emissions. He has more than 25 years of industrial experience with ExxonMobil, including fundamental and applied research, and technical support of refineries and chemical plants. Siegell holds a BE and ME from the City College of New York and a PhD from the City University of New York, all in chemical engineering.


