C3 prices, inventories show modest increases
US Propane - Second Quarter 2005
Propane prices and inventories increased slightly in second-quarter 2005.
Average propane prices rose to 81¢/gal and 85¢/gal at Mont Belvieu, Tex., and Conway, Kan., respectively in June 2005. West Texas Intermediate (WTI) rose to a record of more than $60/bbl then fell back as the quarter ended.
Propane stocks increased to 50.6 million bbl, which is greater than the 5-year average. Petrochemical demand declined but remained strong at 349,000 b/d during second-quarter 2005.
Extraction rates were normal at 528,000 b/d. July natural gas bid week cash prices averaged $7.37/MMbtu on the Texas Gulf Coast. Refinery production continued at below normal rates of 320,000 b/d in the second quarter. Imports declined to 157,000 b/d.
Pricing
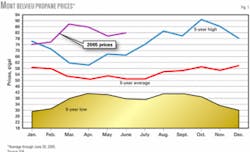
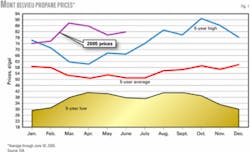
Monthly average propane prices increased modestly from earlier in the second quarter, rising 2% at Mont Belvieu and 4.5% at Conway to 81.4¢/gal and 85.3¢/gal, respectively (Fig. 1). Near the end of June, WTI set new record prices of more than $60/bbl and propane prices reacted strongly moving up 3-4¢/gal.
Propane has been undervalued relative to WTI and it remains so; WTI prices are possibly distorted on the high side due to the low volumes at which it is produced. Light sweet crudes are now a small fraction of total US refinery inputs (even with Louisiana sweet crude included) and these crudes are not generating the volume needed for a “benchmark” price.
Industry may need to discuss the possibility of a new benchmark crude or basket of crudes to better reflect the real world. All of the other NGLs are significantly undervalued relative to WTI; low propane price ratios are not an anomaly. Any downward influence on prices, however, is limited due to psychological factors. There is now increased risk in the market and more price volatility will occur through yearend.
Prices will increase to $0.95-$1/gal at Mont Belvieu and Conway as winter approaches. Propane will also likely stay undervalued relative to No. 2 heating oil and could take market share in those areas where they compete.
The propane-to-Nymex natural gas price ratio should average 1.35:1 on a $/MMbtu basis at the end of the quarter, a decrease from the first quarter’s final ratio of 1.45:1. The ratio should be 1.5-1.6:1 through yearend with lower ratios in the summer.
The propane-to-No. 2 ratio declined to 0.85:1 on a ¢/btu basis and the propane-to-WTI ratio fell to 62% (spot C3 cash prices vs. crude futures).
Propane supply
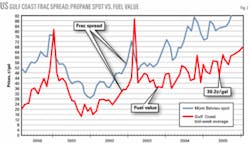
Propane extraction continued at normal rates of 528,000 b/d during the second quarter, according to the US Department of Energy’s Energy Information Administration.1 This continued a run of 7 consecutive months of normal to above-normal extraction rates caused by strong fractionation spreads (Fig. 2). June’s fractionation spread was nearly 30¢/gal of propane.
Processing cash margins have been positive for a longer time and, even though they have fluctuated more wildly, they continue to encourage deep extraction. July natural gas prices, however, may turn out to be an exception; bid week average prices of $7.37/MMbtu were more than $1/MMbtu higher than June prices.
Processing margins will remain positive but just barely so on the Texas Gulf Coast (3¢/gal). Margins will be much stronger in the US Midcontinent (9¢/gal) with lower bid week averages of $7.03/MMbtu for natural gas.
By yearend, margins will continue to improve to about 10-20¢/gal with modest declines in natural gas during the next 3-4 months. Natural gas prices, however, will escalate rapidly to more than $8/MMbtu as winter approaches, which will limit processing margins.
Propane extraction levels should average about 532,000 b/d through yearend. The latest natural gas build of 75 bcf left working gas in storage at 2.031 tcf or 271 bcf more than the 5-year average as of June 17.
Second-quarter refinery production experienced continued weakness at 320,000 b/d, 49,000 b/d below normal, due to severe processing conditions that produce more propylene.
Imports declined from first-quarter levels to 157,000 b/d.
Marine propane imports, exports
Waterborne imports to the US scheduled for June were a substantial 3 million bbl of propane.2 Other than one small cargo scheduled for Puerto Rico, all of this propane is headed for the US Gulf Coast. About 1.3 million bbl was scheduled for July delivery with a 60/40 split between the US Gulf Coast and East Coast.
Spot price netbacks for the western Mediterranean were $24 and $25/tonne into the US Gulf Coast and East Coast, respectively. Netbacks for the North Sea were unusually higher, $33-36/tonne to the same two locations. There should be more imports to the US from both sources in the third quarter.
Waterborne exports continued to be insignificant at less than 5,000 b/d through the end of June. Total exports should average 25-35,000 b/d through the fall.
Petrochemical demand
Petrochemical feedstock economics improved modestly for the second month in a row due to lower feedstock prices in early June. Near the end of June, however, prices increased dramatically.
The increase in cracking economics for the best feedstocks was less than 2¢/lb of ethylene produced. The recent feedstock price increases could offset the rise in cracking margins. As usual, natural gasoline and light naphthas were the most economical feedstocks, followed by 80/20 ethane-propane mix, and refinery raffinates. Propane was the next most economical of the other feedstocks.
Margins were strong due to high demand from the housing sector, which has more than offset what appears to be a slowdown in the automotive sector. Unadjusted feedstock demand was 1.87 million b/d in the mid second quarter.3
Propane demand declined to its lowest level since August 2004, at 340,000 b/d. Demand should increase to 355,000 b/d in the fourth quarter.
US propane inventories
Propane inventories increased to 50.6 million bbl at the end of the second quarter, about 1 million bbl more than the 5-year average.1
Two major factors contributed to this increase in inventories: more imports and high extraction rates. Waterborne imports should continue to be high through the summer due to high netbacks to source countries.
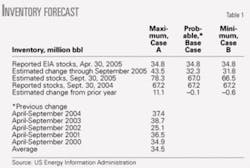
The relatively high petrochemical demand will not be strong enough to hold down total inventories. Stocks will peak at 67 million bbl by the end of September (Table 1).
Regional inventories
Table 2 shows propane storage at the end of April 2005.
PADD I stocks remained 0.5 million bbl below the 5-year average of 4.4 million bbl at the end of the second quarter; the stocks are at a 5-year low. No waterborne imports were scheduled in June, but a 0.5 million bbl cargo was set for July. The region would remain at new 5-year lows until July when increased imports will bring the region back to average levels of 4.9 million bbl.
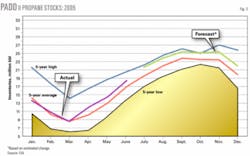
PADD II stocks increased to above-normal levels in April at 11.9 million bbl (Fig. 3). They have been above normal ever since, aided significantly by Canadian imports. With strong gas processing cash margins this summer, stocks should peak by September, reaching 25 million bbl or greater.
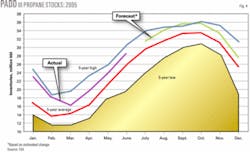
PADD III stocks have been above normal for all of 2005 and should finish the second quarter at 28 million bbl or 2-3 million bbl above average (Fig. 4). The build will continue at above-normal rates with nearly 3 million bbl of waterborne imports scheduled in June and another 0.8 million bbl already scheduled for July. Strong petrochemical demand will have little impact on the inventory increase; stocks could peak as high as 36 million bbl.
Canadian inventories
Canadian stocks built more slowly than expected during the second quarter and were likely to total about 6 million bbl at the end of June.4 This is about 1 million bbl below normal for the quarter. Exports to the US Midcontinent have not been high enough to affect the build to this extent. The only other factor could be a decline in extraction rates, which would be totally unexpected. As a consequence, the peak build will be 9-10 million bbl by late September. ✦
References
1. “Petroleum Supply Monthly,” US Energy Information Administration, Washington, DC, June 2005.
2. “Waterborne LPG Report,” Commercial Services Inc., June 23, 2005.
3. “Hodson Report,” Jacobs Consultancy, June 2005.
4. “LPG Underground Inventories in Canada,” National Energy Board, June 2005.
The author
Michael Horvath Jr. (mhor- [email protected]) is president of M. Horvath & Associates, Houston, and author of The Propane Market Strategy Letter. He served as director of business development at Tauber Oil Co. until retiring in early 2004. Horvath has more than 35 years’ experience in the NGL, petrochemical, and consulting businesses. He holds a BS (1972) in chemistry and mathematics from the University of Houston and has taken postgraduate courses in business law and economics. Horvath is a member and past chairman of the Houston Chapter of the Gas Processors Association and the Gas Processors Suppliers Association.
