Models predict cost savings of Louisiana program
RIGS-TO-REEF-2
Several models can predict the range of savings that companies can expect by participating in the Louisiana artificial-reef program.
Louisiana’s artificial-reef program (LARP) is the largest program of its kind in the world. The program includes more than 83 artificial-reef sites with more than 120 decommissioned platforms.
The program requires companies that donate structures to contribute half of the cost savings realized to the Louisiana artificial-reef trust fund.
This second article in a three-part series provides details on the LARP, describes the cost savings associated with reef donation, and derives quantitative relations that predict the donation amount based on characteristics of the operation.
The first part of the series (OGJ, July 25, 2005, p. 37) discussed various factors affecting reefing decisions.
Planning areas
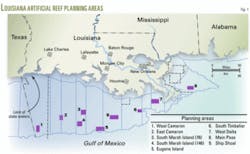
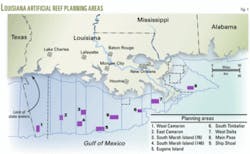
Louisiana has designated nine approved artificial-reefs areas (Fig. 1).
The state used an exclusion mapping process to eliminate areas inappropriate for reef development. The process eliminated from consideration navigation fairways, pipeline corridors, military zones, live bottom areas, bottom type and hydrological conditions, and commercial fishing restricted areas.1
It also identified geologic and man-made features such as faults, gas pockets and vents, sediments with low bearing capacity, irregular and steep seafloor topography, active and relict channels, scarps, salt diapers, natural reefs, pipelines, platforms, subsea production facilities, and unstable areas.
The state, after completing the exclusion mapping, held public hearings across south Louisiana to outline the plan and solicit public input on where to locate reefs.2
Its study also considered use patterns of recreational fisherman, commercial fishermen, sport divers, menhaden, and shrimp fisheries.
Structure donation
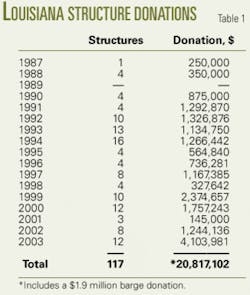
Table 1 shows the number of structures donated and money received.
From 1987-2003, companies donated 120 structures to LARP, which included 63 three and four-pile jackets, 54 eight-pile jackets, one barge, one tug, and one deck.
Hurricanes had destroyed 10 of the 120 donated structures.
The number of structures donated and money received has varied. During the past decade, companies have donated about 8 structures/year and about $1.37 million/year or $169,000/structure.
As of May 2004, LARP’s trust fund has accrued $20.8 million.
Program statistics
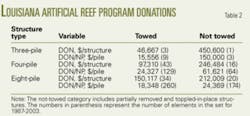
Table 2 shows the average money donated per structure and per pile according to removal method and structure type. From 1987-2003, companies towed 80 structures to location, toppled in place 29, and partially removed 8 structures.
The average donation for a structure towed to site is $117,000 vs. $233,000 for structures not towed, with $21,000 and $37,000 the average donation per pile, respectively.
If one outlier point is removed from the data set (a $2.5 million donation), then the average structure donation and donation per pile are $170,000 and $26,000, respectively. One would expect structures towed to site to contribute less than the topple-in-place and partial removal option because of the added cost of towing the structure.
The average donation per towed structure is about $53,000 less than the average donation for structures not towed. Because the average distance for the tow was 20 miles, the inferred cost to transfer a platform to a reef site is about 53,000×2/20 = $5,300/mile.
Decommissioning costs generally increase with the structure complexity and water depth at the site (OGJ, Oct. 3, 2003, pp. 39-47), and the data in general support this contention because donation amounts for three and four-pile structures are less than for eight-pile structures.
For structures towed to location, the average donation per structure increases to $97,000 for a four pile and to $150,000 for an eight pile from $47,000 for a three pile.
Structures toppled-in-place and partially removed have a reverse trend of $450,000 for a three pile, $246,000 for a four pile, and $212,000 for an eight-pile structure. This trend is probably due to the small sample size and the divergent nature of the removal methods.
On a pile-normalized basis, economies of scale are evident across the four and eight-pile categories.
Operator involvement
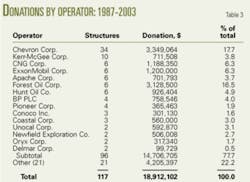
Chevron Corp. (formally ChevronTexaco) is the operator or partner in 861 Gulf of Mexico leases, and with its planned merger with Unocal would hold almost 1,200 leases and several hundred structures. Chevron owns the most infrastructure in the gulf and it is not surprising that it has also donated the most platforms to LARP.
Six operators have each donated six or more structures: KerrMcGee Corp., CNG Corp., ExxonMobil Corp., Apache Corp., Forest Oil Corp., and Hunt Oil Co. (Table 3).
Chevron and Forest Oil have contributed more than one-third of all structures donated. Thirty-seven operators in total have participated in the program, with 15 operators contributing more than 75% of the donations.
Capture probability
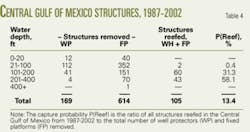
The percent of structures placed in reefs, P(Reef), as a function of water depth is the total structures reefed during 1987-2002 divided by the number of well protectors (WP) and fixed platforms (FP) removed during this same period, as follows:
P(Reef) = (Number of structures reefed)/(Number of structures removed)
This analysis does not consider caissons because they are not appropriate reef material; therefore, the analysis only counts well protectors and fixed platforms from the inception of LARP until 2002, the last year with available removal statistics.
The analysis uses the central gulf planning area as a geographic proxy for the pool of candidate structures (Table 4). Structures in 100 ft of water or less are almost always brought to shore for recycling, while the donation frequency increases rapidly for structures in water deeper than 100 ft.
Since 1987, companies have reefed 13% of all eligible central gulf structures and more than half of structures in water deeper than 200 ft.
Model specification
A linear function can model the structure donation, as follows:
DON(s) = αo + ∑αiXi (1)
In the equation, the dependent variable is the donation, DON(s), in dollars, and the descriptor variables are:
• X1 = WD = Water depth, ft.
• X2 = DIST = Distance to reef site, miles.
• X3 = NP= Total number of piles.
• X4 = TIP = Topple-in-place or partial removal option.
All variables are numeric except the topple-in-place variable, which is a binary indicator designating whether the structure was toppled-in-place or partially removed. If TIP = 1, the structure is toppled-in-place or partially removed. Otherwise TIP = 0.
Note that if DIST = 0, then TIP = 1, and if DIST > 0, then TIP = 0.
Expected signs
The model estimates the coefficients αi, i = 0, 1, 2, 3, 4 through a least-squares regression. The coefficient α0 represents a fixed term component, while αi, i = 1, 2, 3, 4, are associated with the corresponding model variables.
Decommissioning costs generally increase with water depth and structure complexity; therefore, one would expect coefficients of the variables WD and NP (α1 and α3) to be positive because the donation is expected to increase with these variables.
As the distance towed to a reef site increases, one would suspect that potential savings resulting from rig donation would decrease and that the coefficient of the DIST variable should be negative.
One would expect structures toppled-in-place or partially removed to save more in decommissioning costs than a towed structure, and therefore the α4 coefficient should also be positive.
Model results
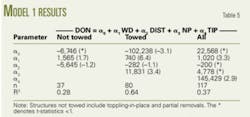
Tables 5-7 depict the regression model results.
Table 5 indicates that the regression model is a reasonably good indicator of the expected donation, especially for structures towed to location. Most of the model coefficients are statistically significant and of the expected sign.
Table 6 shows the reefed structures as a function of complexity. Although decomposition creates more homogenous categories, it also reduces the number of elements within those categories, and therefore it is not surprising that the model fits improve slightly because of the statistical nature of model construction. The range of the model fits are large but are considered reasonable for the factor set employed.
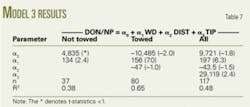
Table 7 presents the model that constructs a donation amount normalized by the number of piles.
All cost estimates describe the outcome of an engineering estimate performed before the operation, which may subsequently be modified through negotiation.
Calculated cost savings do not represent actual cost savings, however, and are expected to exhibit weaker correlations with process descriptors than otherwise expected.
Water depth is the most significant variable across all of the models, and donation is a negative function of tow distance, as expected. Additional variables might assist in deriving improved models, but the incremental improvement is likely to be marginal because of the nature of the processes involved and the limited ability of any factor set to capture the variability of the operation.
Example
Consider an eight-pile structure (NP = 8) located in 110 ft water depth (WD = 110) that is a candidate for reefing. The nearest reef planning area is located 15 miles away (TOW = 15). The donation of a reefed structure is estimated as follows.
From Table 5, for a structure towed to location:
DON(s) = -102,238 + 740(110) - 282(15) + 11,831(8) = $69,580
From Table 6, the model results yield:
DON(s) = 37,069 + 222(110) -323(15) = $56,534
Table 7 yields:
DON(s)/NP(s) = 10,485 + 156(120) - 47(24) = $5,970/pile
Because the structure is an eight pile the total is 8($5,970) = $47,760.
The difference in the donation estimates is due in part to the model uncertainty, the data employed to construct the models, and the preference of the user in model selection.
It is difficult to know which of the three models is the best predictor of the cost savings, and the user may apply model fit or choose another criteria for selection.
A range of values that bound the likely donation is probably the best approach to follow. ✦
References
1. Wilson, C.A., and Van Sickle, V.R., “Louisiana state artificial-reef plan,” Louisiana Department of Wildlife and Fisheries, Technical Bulletin, Vol. 41, 1987, pp. 1-51.
2. Kasprzak, R.A., “Neither gone nor forgotten,” Louisiana Conservationist, Vol. 51, 1999, pp. 4-7.
