Model predicts equilibrium water content of high-pressure acid gases
A new simple, theoretically based model predicts equilibrium water content of pure acid-gas components and acid-gas mixtures.
The model is applicable at temperatures of 32-212° F. and pressures of 14.7-2,000 psia for pure acid-gas components and acid-gas mixtures that contain up to 5 mole % hydrocarbons.
The new model provides a quantitative estimate of changes in the equilibrium water content of acid-gas mixtures due to changes in system pressure, temperature, or composition. Compared with an available experimental data set (159 points), the new model results in an absolute average error of 14% vs. 15% for AQUAlibrium, a commercial software package.
Compressed acid-gas reinjection into producing, depleted, or nonproducing formations has emerged as a viable alternative to traditional sulfur-recovery processes. An effective reinjection scheme design requires the water content, phase behavior, and physical properties of the acid-gas mixture for the range of operating temperatures and pressures.
Although phase behavior and physical properties are predicted relatively well with existing equations of state, water content is not. Moreover, existing correlations and models have limitations when applied to pure or acid-gas mixtures.
Sour natural gas
Natural gas is “sour” if it contains more than 4 ppm (vol), 5.7 mg/cu m, or 0.25 grains/100 scf of H2S.1 The H2S must be removed before the gas can be used. If H2S is present, the gas is usually sweetened with H2S absorption into an amine solution.
Other methods, such as carbonate processes, solid-bed adsorbents, and physical absorption are used to a much lesser extent.1
The recovered H2S or CO2 gas stream can be flared in waste-gas flares or modern smokeless flares, incinerated, used to produce elemental sulfur, or reinjected in a suitable underground formation.
The most popular sulfur-recovery method uses a modified Claus process in which a combustion furnace followed by a series of catalytic reactors produce elemental sulfur from H2S. Because Claus plants recover less than 100% of the sulfur, the tail gas is incinerated, emitting SO2 and CO2 to the atmosphere.
Due to high capital and operating costs, as well as low demand and oversupply of elemental sulfur, acid-gas reinjection into deep geological formations has emerged as a viable option. In addition to providing a cost-effective alternative to sulfur recovery, the deep injection of acid gas reduces emissions and alleviates the public concern resulting from sour-gas production and flaring.
The effective design of an injection scheme requires water content, phase behavior, and physical properties of the acid gas mixture over the range of operating temperatures and pressures. Although phase behavior and physical properties are relatively well predicted with existing equations of state, water content is not.2
Literature
The problem of determining the water vapor content of sour natural gas is essentially that of calculating the composition of a mixture at certain temperature and pressure conditions. The methods available for calculating the water content of natural gas fall into three categories:3
• Partial-pressure approach (ideal model)
• Empirical plots and correlations.
• Equations of state.
Partial-pressure approach
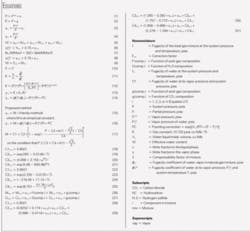
If a mixture acts so that the vapor phase behaves as an ideal gas and the liquid phase behaves as an ideal solution, then Raoult’s law and Dalton’s law (Equations 1 and 2 in the accompanying equations box) can describe the phase equilibria.4
Equating Raoult’s law and Dalton’s law for water, w, and rearranging yield Equation 3.
Because water is almost immiscible in the hydrocarbon liquid phase, xw is usually assumed to be unity; therefore, the water mole fraction in the gas, yw, can be calculated with Equation 4.
Ideal gas behavior is a limiting case and real gas-gas mixtures seldom approach this condition except at low pressures and high temperatures. Equation 4 is recommended for system pressures up to about 60 psia.4
Empirical plots, correlations
Empirical plots are still widely used for engineering calculations. For a lean, sweet natural gas, the McKetta and Wehe chart can be used.5
The McKetta-Wehe chart includes correction factors for formation water salinity and gas gravity. The water content in these charts is the maximum that the gas can hold at the pressure and temperature shown. It is fully saturated; the temperature is the water dew point temperature of the gas at the pressure and concentration shown (relative humidity is 100%).
To facilitate the use of these charts, Behr (OGJ, Nov. 7, 1983, p. 96) and Kazim6 proposed alternative analytical expressions that fit the natural gas dew point vs. water content.
These charts and correlations, however, will result in serious errors if used for acid or sour natural gases because H2S and CO2 can hold more water at saturation conditions than methane or sweet natural gas mixtures. Corrections for H2S and CO2 should be applied when the gas mixture contains more than 5% H2S and or CO2 at pressures greater than 700 psia.7
To correct for significant acid-gas content, Maddox proposed the correlation in Equation 5 to calculate a weighted average water content, W.1
Maddox assumed that nitrogen holds about 6-9% less water than methane. He therefore assumed it was a hydrocarbon, thus providing a small safety factor. This correlation provides adequate predictions at low pressures but tends to underpredict water content at high pressures.
The Robinson correlation for sour gases (OGJ, Feb. 6, 1978, p. 76) was developed based on a modification by Soave of the Redlich and Kwong (SRK) equation of state. They generated a series of charts at pressures of 300, 1,000, 2,000, 3,000, 6,000, and 10,000 psia for temperatures of 50-350° F.
Robinson considered all hydrocarbon components to be essentially CH4 and assumed that CO2 carries only about 75% as much water as H2S for the entire pressure and temperature range. To use these charts, therefore, one uses the relation in Equation 6 to calculate the effective H2S dry-gas composition.
The charts are applicable for an H2S-equivalent composition of up to 40 mole %. The water content on these charts is reported in bbl/MMscf, which can be converted with Equation 7.
Using this method is cumbersome because of the multiple interpolations involved, and the method cannot be used for pure acid-gas mixtures, i.e., no hydrocarbons in the mixture.
Wichert and Wichert (OGJ, Oct. 27, 2003. p. 64) proposed a relatively simple acid-gas correction based on the equivalent H2S content (Equation 8, similar to that of Robinson but assumes that the CO2 carries only 70% as much water as H2S at the same conditions).
They presented a single chart where one could obtain a correction factor, Fcorr, at a given temperature, pressure, and equivalent H2S composition. One then calculates the water content of the sour gas with Equation 9.
This method is applicable for temperatures of 50-350° F. and pressures of 100-10,000 psia. It is limited, however, to an H2S-equivalent concentration of 50% and cannot be used for pure acid-gas mixtures.
Equation of state models
The Robinson approach previously mentioned originated from the concept of partial fugacity of component “i” in a mixture (Equation 10).
Equation 11 shows the equilibrium constant, Ki, expressed in terms of the fugacity coefficient for a component in a mixture.
This predictive model was developed with the SRK equation of state.8 It uses sophisticated mixing rules that adjust the interaction parameters using published data for binary mixtures of CH4-water, H2S-water, and CO2-water.
Because of the limited amount of experimental data, this method tends to underpredict the water content of acid-gas mixtures at high pressures. It also requires the use of a computer and is not applicable to acid-gas mixtures with more than 40 mole % equivalent H2S.
Sharma and Campbell (OGJ, Aug. 4, 1969, p. 136) developed a predictive method based on the McLeod corresponding-states approach (OGJ, July 7, 1969, p. 115). This method includes these steps:
1. Calculate the Eykman molecular refraction critical pressure, critical temperature, and Z factor of the mixture using the McLeod corresponding-states approach.
2. Obtain K from a chart or calculate using Equation 12. From a generalized fugacity chart, determine the value of f/P and therefore f for the gas mixture on a water-free basis.
3. Determine the gas-water content from Equation 13.
This model was originally intended to predict the water content of sour gases with less than 20 mole % of any component except methane for a nominal temperature range of 100-160° F. and a pressure range of 200-2,000 psia.9 The model, however, underpredicts the water content of acid-gas mixtures with low hydrocarbon content; it errs as much as 84% especially at high pressures.
Haridy et al. (OGJ, Apr. 29, 2002, p. 50) proposed a theoretically based mathematical model (Equation 14) that estimates the water content of a saturated natural gas, both sweet and sour, up to 10,000 psia and 460° F.
The model uses the SRK equation of state to calculate the fugacity coefficient of water in a natural gas mixture. It includes interaction parameters for water with hydrocarbons and water with CO2 and H2S. The calculation procedure, however, is tedious and must be performed on a computer.
This model, like Sharma-Campbell model, is inaccurate at high pressures and high acid-gas contents; errors exceed 85%.
AQUAlibrium is a rigorous thermodynamic model specifically designed to calculate phase equilibria between vapor, aqueous liquid, and nonaqueous liquid phases for systems containing light hydrocarbons, H2S, CO2, and water. AQUAlibrium uses a Henry’s law approach for the aqueous phases and the Peng-Robinson Equation of State for the nonaqueous phases.10
The model parameters are extracted from experimental data by regression. This software is widely used in the gas processing industry.
Proposed methods
Theoretically based models, like the ideal gas law and physical properties models, provide the correct qualitative behavior for simple systems but must be adjusted to account for complex system nonidealities. The Sharma-Campbell and Haridy models represented the best candidates for the new model because they are both based on the equilibrium requirement of equal fugacities.
We did not use the Sharma-Campbell model due to complexities involved in calculating the true critical properties, based on the Eykman molecular refraction approach, for the compressibility factor and fugacity coefficient of gaseous mixtures. Because we wanted to use a simple mathematical model with a theoretical basis, we decided to modify the Haridy model using a function in the form of Equation 14, which resulted in Equation 15.
We fitted and generalized the factor, M, using available experimental data for pure H2S and CO2 from Selleck11 and Weibe and Gaddy,12 and from Clark10 for acid-gas mixtures.
We then tested the modified model for correlation accuracy and predictive capability. We compared the results to industry-published data and to AQUAlibrium results.
We had to fit equations for the water vapor pressure and water fugacity at vapor pressure and system pressure to avoid using a computer for fugacity calculations. Generalized equations for vapor fugacity and water molar volume are also required.
Curve-fitted equations appear in the accompanying sidebar.
Findings
The Haridy model’s shortcoming is an inability, at high pressures for pure acid-gas mixtures, to predict the behavior of acid gases in the liquid or dense phases.
Our technique, based on Equation 15, uses the available water content data to fit the multiplier M. This multiplier is then generalized to predict accurately water content for a range of temperatures (32-212° F.) and pressures (14.7-2,000 psia).
Equation 16 is the resulting correlation.
Pure components
We used curve-fitting software to fit the new multiplier as a function of pressure. The data trend looked like a statistical cumulative function. A transition pulse cumulative function was chosen to describe accurately the relationship of M with pressure. This function had four independent parameters C1, C2, C3, and C4 that were fit as a function of temperature.
Our challenge was to produce functions that describe the behavior of H2S and CO2 in the vapor phase and the two-phase regions. Moreover, H2S and CO2 hold more water in the liquid phase than in the vapor phase and to a lesser extent than the liquid-like phase in the supercritical region.
If the condition associated with Equation 17 is true, then Equation 17 will be evaluated and value of M retained. If the condition is not satisfied, then M = C1; the transition of M from C1 to the one calculated in Equation 17 occurs at or near the pressure corresponding to the change in water content of the gas due to phase changes.
We had to fit the parameters C1, C2, C3, and C4 therefore such that they can capture this transition at different temperatures. This resulted in two sets of equations for these parameters: Equations 18-21 for H2S and Equations 22-25 for CO2.
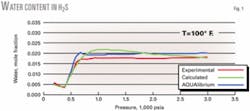
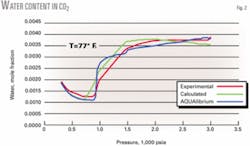
Figs. 1 and 2 show that the new equations provide good predictions for the individual pure components H2S and CO2.
Fig. 1 shows that at pressures greater than 1,000 psia, the water content of H2S tends slightly to decrease with increasing pressure, which results in a deviation of about 22%. This is not physically correct because the experimental data show that, once in the liquid or dense phase, water content of H2S slightly increases at higher pressures.13
This nonphysical behavior is due to the chosen function of M with its parameters not compensating sufficiently for the decrease in water content as determined from the original model. We found that these functions provided the best predictions for the behavior of pure H2S and CO2; the small error made little difference in the overall results.
Acid-gas mixtures
The next step in the development process was to combine the two sets of equations so that the model was applicable for acid-gas mixtures. To maintain the model’s simplicity, the new mixing rule is a function of composition only.
We evaluated two mixing rules. The first involved mixing the multiplier M (Equation 26). The second option was to mix the parameters C1, C2, C3, and C4 within the multiplier M as in Equation 27.
Mixing M resulted in complex behavior, which opposed our goal of simple composition dependency. We therefore further developed the second mixing rule.
Simple mixing rule
Although this approach appears to be complicated, the approach to providing Mmix simply involved obtaining a mixture value for the parameters C1, C2, C3, and C4 based only on composition.
Using the solver tool in Excel and averaging over the range of temperatures and pressures of the experimental data, we obtained smooth functions for fi and gi in terms of only acid-gas compositions. We obtained Equations 28-31 using curve-fitting software.
For pure components H2S or CO2, the mixture parameters will reduce to pure component values because one mole fraction goes to zero.
Model comparisons
Table 1 shows how the new model compares to the original model and AQUAlibrium results for 159 experimental water-content data points. Alami presents detailed model comparisons and comparison plots.14 The original model refers to the base model used in this study without the multiplier M.
Acknowledgments
The authors thank Paul Davis from Alberta Sulfur Research Ltd., Edward Wichert from Sogapro Engineering Ltd., and John Carroll from Gas Liquids Engineering Ltd. for their valuable input. ✦
References
1. Maddox, R.N., “Gas and Liquid Sweetening,” 2nd ed., Norman, Okla.: Campbell Petroleum Series, 1974.
2. Clark, M.A., “Experimentally Obtained Saturated Water Content, Phase Behavior and Density of Acid Gas Mixtures,” dissertation, University of Calgary, 1999.
3. Kumar, S., “Gas Production Engineering,” Houston: Gulf Publishing Co., 1987.
4. Campbell, J.M., “The Basic Principles,” 7th ed., Norman, Okla.: Campbell Petroleum Series, 1994.
5. McKetta, J.J., and Wehe, A.H., “Use This Chart for Water Content of Natural Gases,” Petroleum Refiner, August 1958, p. 153.
6. Kazim, F.M.A., “Quickly calculate the water content of natural gas,” Hydrocarbon Processing, March 1996, p. 105.
7. “Engineering Data Book,” 11th ed., Tulsa: Gas Processors Suppliers Association, 1998.
8. Robinson, J.N., “Equilibrium Water Vapor Content of Sour Natural Gases at High Pressure,” dissertation, University of Calgary, 1976.
9. Sharma, S.C., “Equilibrium Water Content of Gaseous Mixtures,” dissertation, University of Oklahoma, 1969.
10. Clark, M.A., et al., “Designing an Optimized Injection Strategy for Acid Gas Disposal Without Dehydration,” 77th Annual Convention of the Gas Processors Association, Dallas, Mar. 16-18, 1998.
11. Selleck, F., Carmichael, L.T., and Sage, B.H., “Phase Behavior in the Hydrogen Sulfide-Water System,” Industrial & Engineering Chemistry Research, Vol. 44 (1952), pp. 2219-26.
12. Wiebe, R., and Gaddy, V.L., “Vapor Phase Composition of Carbon Dioxide-Water Mixtures at Various Temperatures and Pressures to 700 Atmospheres,” J Am.Chem.Soc., Vol. 63 (1941), pp. 475-77.
13. Carroll, J., “The Water Content of Acid Gas and Sour Gas From 100 to 220°F and Pressures to 10,000 psia,” 81st Annual Convention of the Gas Processors Association, Dallas, Mar. 11-13, 2002.
14. Alami, I.A., “Equilibrium Water Content of High Pressure Acid Gases,” dissertation, University of Calgary, 2004.
The authors
Ismail Alami (ismail.alami @aramco.com) is a process engineer in the process and control systems department for Saudi Aramco, Dhahran. He has been involved with the design, construction, and start-up of several Saudi Aramco gas plants. Alami’s main area of expertise is sour-gas treating and sulfur recovery. He holds a BS in chemical engineering from King Fahd University of Petroleum and Minerals, Dhahran, and an MS in chemical and petroleum engineering from the University of Calgary.
Wayne Monnery is a vice-president for Xergy Processing Inc., Calgary. He is a consultant to the petroleum industry, specializing in gas processing and sulfur recovery. Monnery holds a PhD in chemical engineering from the University of Calgary.
William Svrcek is a chemical and petroleum engineering professor at the University of Calgary and an expert in process simulation and control. He has been involved in developing process simulation software, teaching courses to the natural gas industry locally and internationally, and is the author of more than 100 publications. Svrcek holds a BS and PhD in chemical engineering from the University of Alberta and is a registered professional engineer in Alberta and Ontario.


