US oil, gas demand rising again in 2005
While US energy demand will climb again this year as the economy continues to grow, signs of change are clear.
The pace of economic growth will decline from its 2004 level, and energy efficiency will increase in the face of high prices.
This year, fear of a petroleum product supply crunch has driven nominal oil prices to all-time highs. Weak growth in product stocks has combined with forecasts for another heavy hurricane season to offset the effects of strong refinery activity and robust imports.
US oil and natural gas production, which declined last year, will record modest gains in 2004. This year thus will be the first since 1991 in which crude oil production has increased in the US. Prices will remain high and volatile, though, as product inventories fail to post sizable gains.
International developments
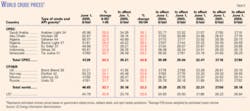
On June 15, the Organization of Petroleum Exporting Countries raised its crude oil output ceiling for members other than Iraq by 500,000 b/d to 28 million b/d in an attempt to cool high and volatile crude prices amid tightness in key middle distillates markets. That day the front-month futures price of crude on the New York Mercantile Exchange gained 57¢/bbl to settle at $55.57/bbl.
The move was mostly dismissed as a formality as the organization’s members, excluding Iraq, already were producing at the new target level, if not more.
OPEC’s new group quota was effective from July 1, and the organization further authorized its president to announce an additional 500,000 b/d increase in the ceiling before its next meeting should oil prices remain at then-current levels or continue to rise.
This latest quota hike continued a trend that began a year ago. Effective July 1, 2004, OPEC raised its official output ceiling to 25.5 million b/d from 23.5 million b/d in an effort to lower crude prices before they threatened global economic growth. But rather than retreating, prices escalated, and OPEC implemented subsequent export target hikes with little effect on prices.
Global demand
In its most recent Oil Market Report, the International Energy Agency said that although demand growth is slowing in China and the European countries of the Organization for Economic Cooperation and Development, demand in North America and in the OECD Pacific is taking up the slack.
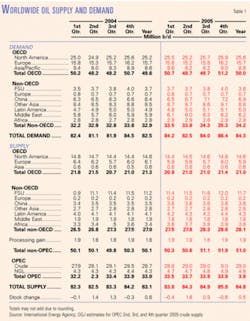
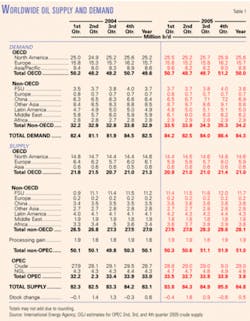
In most regions, IEA sees declines in the growth of oil demand this year. Therefore, the Paris-based agency forecasts that in 2005, average worldwide oil demand will grow 2.2% to 84.3 million b/d (Table 1). Last year’s worldwide oil demand growth is pegged at 3.4%.
The largest annual growth rate this year will be in Chinese oil demand, which IEA forecasts at 7.1%. This compares to 15.4% growth last year and 11% the prior year.
Last year, monthly demand growth rates in China reached 24% in May and 27%. in June The product with the greatest expected annual percentage growth this year, IEA says, will be naphtha at 11%.
IEA projects that 2005 oil demand in the Middle East will be up 5% vs. 5.8% last year. In non-OECD Europe, demand will grow 2.8% this year, up from 2.2% growth in 2004.
Also, the agency forecasts that oil demand will grow 3.4% in Africa and 2.4% in Latin America this year. North American oil demand is forecast at 1.5% annual growth, up an average 390,000 b/d but slower than last year’s growth rate of 2.5%.
Worldwide production
Non-OPEC oil production this year will average 51 million b/d, according to IEA estimates. Russian output growth has slowed, and production is nearly stagnant in all other areas except Africa.
IEA estimates that total OECD oil production will decline 210,000 b/d, with no change in the Pacific countries, a small gain in North America, and a 230,000 b/d decline in Europe. Officials in Mexico and Norway last month claimed that their countries are producing all-out, with no spare capacity.
Meanwhile, the agency predicts that supply from the former Soviet Union will grow 460,000 b/d to average 11.68 million b/d. This compares with 2004 growth of roughly twice that margin.
Reduced upstream investment and higher export taxes and a heightened sense of regulatory uncertainty, combined with a drop in production by beleaguered OAO Yukos, underlie the decline in Russian output, said IEA.
“Over the last 10 months, the tax burden on Russian oil producers has increased considerably,” said Yulia Woodruff, Russian oil analyst at Energy Security Analysis Inc., Boston.
In August 2004, the Russian government introduced a mechanism for assessing the crude export duty, which is linked to the external price of Urals crude and recalculated bimonthly, ESAI reported. The duty rises progressively as the price of Urals crude exceeds $25/bbl. The latest export adjustment took effect on June 1, bringing it to a record $18.50/bbl.
African supply will grow to 3.76 million b/d this year, an annual increase of 320,000 b/d. Output gains will be primarily in Nigeria, which might be jockeying for a bigger share of the OPEC quota.
OPEC-Saudi Arabia specifically-can no longer function as the swing producer when oil demand spikes. OPEC members have little spare production capacity, and what little there is, perhaps 1.5 million b/d, is in Saudi Arabia. The Saudi government has declared a policy of maintaining spare capacity at that level as a cushion against global supply disruptions.
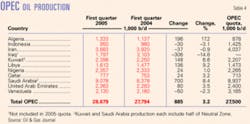
The Baker Hughes Inc. rig count shows that additional capacity might be coming online in the organization’s member countries. In OPEC countries, the count of active rigs was 280 in May, up from 245 in the same month a year earlier and 215 in May 2003.
IEA’s latest estimates show that OPEC crude production in the first quarter of this year averaged 28.8 million b/d, OPEC natural gas liquids production 4.7 million b/d, and total non-OPEC supply 50.3 million b/d. OECD stocks declined 400,000 b/d.
OGJ forecasts that OPEC crude production will average 29 million b/d in the second, third, and fourth quarters of this year, which will result in an average stockbuild of 500,000 b/d for 2005.
Oil prices
Tight product markets and limited spare refining capacity in the US are propping up crude oil prices, in spite of the amount of oil that OPEC exports or the amount of crude in storage. Fears about petroleum product supply crunches in the third quarter, when demand typically peaks, were exacerbated when second quarter demand was unusually strong and refining utilization high.
The near-month closing price of crude on the New York Mercantile Exchange reached its first peak this year at $57.27/bbl on Apr. 1. The second peak came on June 27, less than 2 weeks after OPEC implemented its most recent output ceiling hike. That day, the NYMEX near-month crude contract settled at $60.54/bbl.
The lowest closing price so far this year was $42.12/bbl, on Jan. 3, the first trading day of 2005. So far this year, oil has traded on the NYMEX at about 7.5-8.5 times the price of the thermal equivalent of natural gas.
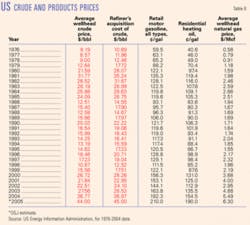
The average first quarter 2005 US wellhead oil price was $43.21/bbl, up 37% from the same year-earlier period. OGJ forecasts that the wellhead price of oil in the US will average $44/bbl for the year. Last year the wellhead price averaged $36.77/bbl.
Product prices
The price of self-serve unleaded motor gasoline excluding tax in the US climbed 21% year-on-year in the first 4 months of 2005. This price hike coincided with a 6% increase in total motor gasoline stocks and a mere 0.9% gain in demand, according to recent figures from the Energy Information Administration.
Jacques Rousseau, an analyst at Friedman, Billings, Ramsey & Co. Inc., in mid-June, said: “Gasoline inventories are currently 10 million bbl, or 5%, above year-ago levels. We continue to expect supply to be sufficient for the summer driving season. This should allow refiners to get an earlier start on distillate production for the winter and alleviate current concerns over low supply.”
Distillate inventories at below-normal levels caused prices to spike early this year, as demand was little changed in the first quarter from the same period a year earlier. The average retail price of No. 2 heating oil moved up 45% for the first 3 months vs. the same period last year.
For the first 3 months of this year, the average residual fuel oil retail price gained 18% year-on-year. In this case, inventories were unchanged from a year earlier, while demand was up nearly 6%.
Natural gas prices
The wellhead price of natural gas will average $6.30/Mcf this year, OGJ forecasts. This compares to $5.49/Mcf last year, $4.88/Mcf in 2003, and $2.95/Mcf a year earlier.
In spite of warmer winter weather, the first quarter average wellhead price was $5.70/Mcf this year, up from $5.22/Mcf a year earlier. On NYMEX, front-month gas futures averaged $6.503/MMbtu in the first quarter.
Above-average temperatures and increased demand for air conditioning in June pushed prices on the futures exchange higher. On June 7, the NYMEX closing price for gas delivered in July was $7.69/MMbtu.
US economy
OGJ forecasts that the US gross domestic product will grow 3.5% this year, compared with 4.4% last year.
In the first quarter, GDP grew 3.5%, following a 3.8% increase in the final 2004 quarter and 4% increase in the third quarter of last year.
The US and global economies are slowing, but there is no cause for alarm yet, according to analysis released in June by the Conference Board, the research organization that produces the consumer confidence index and the leading economic indicators for the US and other major nations.
“While it is easy to attribute the slowdown either to Federal Reserve Board rate hikes or to high oil prices, it is likely that both have had rather modest effect up to this point,” said Gail D. Fosler, executive vice-president and chief economist of the Conference Board. “The US is still extremely liquid, personal income has been revised up, and the housing market is robust.”
Another study was less optimistic. Rising oil prices are hampering the growth of US industrial manufacturers, according to a Pricewaterhouse-Coopers survey of executives released last month.
Nearly half of the manufacturing executives surveyed cited rising energy prices as a potential barrier to growth over the next 12 months. While 59% of them said they were passing through price increases, 41% reported shrinking gross margins during the most recent quarter.
“Higher oil prices affect industrial manufacturers on multiple fronts,” said Jorge Milo of PWC’s industrial manufacturing practice. “Raw material prices go up, energy costs increase to operate their facilities, and distribution costs rise to transport their products to their customers.”
US energy demand
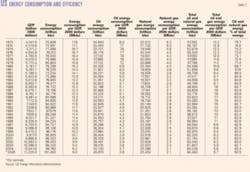
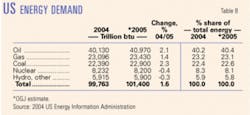
After setting a record high in 2004, total US energy demand will climb slightly this year. But the amount of energy consumed per dollar of GDP will decline, continuing a trend of annual efficiency gains (Table 7).
Along with GDP growth this year, OGJ forecasts that US consumption of energy will increase 1.6%, bringing total US energy demand to 101.4 quadrillion btu (quads).
The forecast consumption growth rate is slightly higher than last year’s. In 2003, US energy consumption declined following a 2.2% spurt the prior year.
Energy use efficiency will improve to 9,000 btu/$ of GDP from 9,200 btu/$ last year and 9,450 btu/$ a year earlier.
Energy sources
OGJ predicts growth this year in the use of the three big sources of energy in the US-oil, gas, and coal. Consumption of other energy sources, including nuclear, hydroelectric, and other renewable energies, will decline marginally.
Oil and coal will claim bigger portions of the energy mix than last year, while the natural gas share eases. Combined, oil and gas will satisfy 63.5% of total 2005 US energy demand.
Petroleum products, including transportation fuels and heating oil, will account for 40.4% of all energy used in the US, up slightly from last year’s level. This will equal the consumption of 40.97 quads of oil, a 2.1% gain from a year ago. Gas demand in the US will be 23.43 quads, up 1.4% from last year.
Coal demand will grow the most among all energy sources. OGJ forecasts that the use of coal will total 22.9 quads this year, climbing 2.3%, spurred by increased economic activity and high oil and gas prices.
Although preliminary data show that total US generation of electric power increased 1.9% in 2004, coal’s share of generation decreased 1.8%, resulting in only a 10-million short-ton increase in coal use by the electric power sector, EIA reported. Meanwhile, the use of coal outside the power sector slipped by 0.7% to 89.1 million short tons last year.
Demand for nuclear energy will contract from a record high last year. No new nuclear power plants have come on line in the US since 1996, but last year’s was nuclear energy’s fifth annual record since 1998.
OGJ expects nuclear power generation to decline 0.4% this year to 8.2 quads. This would lower nuclear energy’s share of the US market to 8.1% from 8.3% last year. Recent data show a decline in the amount of nuclear net generation of electricity during the first couple of months of this year. The number of operable nuclear units in the US remains at 104, unchanged since 1998.
US demand for energy from renewable sources also will post a small decline this year. OGJ expects hydroelectric power and other sources, such as wood, solar, and wind, to account for just 5.8% of all energy consumed in the US, totaling 5.9 quads.
The largest of the renewable energy sources is hydroelectric power, which is heavily dependent on weather. Drier-than-normal weather in the Northwest early this spring followed an extremely dry winter, resulting in lingering moderate-to-extreme drought conditions at the end of April, the National Oceanic and Atmospheric Administration (NOAA) reported.
The second-largest renewable energy source is wood, which is heavily used by industrial consumers. Waste, including municipal solid waste, landfill gas, tires, and other items, is the third-largest renewable energy source and is most heavily used by the electric power industry.
Natural gas forecast
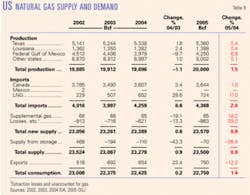
Natural gas demand in the US will increase 1.5% this year, boosted by strong summer cooling. Last year gas consumption growth was nearly negligible at just 0.2%.
A combination of plentiful inventories, relatively tepid demand, and higher prices has been the status quo in the natural gas market for the past 2 years. Despite an abundance of available gas in the US, the commodity’s apparent tie to the price of oil and some supply disruptions have joined forces to put a floor under its prices.
Working gas in storage was 1,963 bcf as of June 10, according to EIA estimates, placing stocks 216 bcf higher than a year earlier and 294 bcf above the 5-year average of 1,669 bcf. OGJ expects a 70 bcf storage build for the year, down from last year’s 110 bcf injection and a build of 194 bcf in 2003.
Through the first quarter of this year, gas demand by residential, commercial, and industrial consumers was down from the same 3 months of 2004, but demand in the electric power sector was up slightly year-on-year.
Some of the overall 3% decline in first quarter gas demand can be attributed to warmer winter weather. NOAA reported that the US experienced its 10th warmest winter on record this year. OGJ expects warmer summer weather to drive demand for gas this year. Where fuel-switching from distillate fuel oil is possible there will be price incentives in favor of consuming gas.
OGJ also expects a 1.5% increase in US gas production this year. Gulf of Mexico production will rebound somewhat from last year’s hurricane-related slump, although predictions call for another active hurricane season. NOAA projects 12-15 tropical storms in the Atlantic Ocean this year, with 7-9 becoming hurricanes, 3-5 of them major storms.
Further supporting the expectation of increased US gas production is the elevated Baker Hughes count of active gas-directed rotary rigs. The number of gas rigs for the week of June 10 was 1,196, up from 1,024 a year earlier.
Gas production in the Canadian Rockies will rise this year, too, and more Canadian gas will make its way to US markets. Gas imported from Canada will grow 1% from last year to 3,644 bcf.
OGJ forecasts an 11% rise in LNG imports for 2005. Last year LNG imports surged to 652 bcf from 507 bcf, up from 2002 LNG imports of just 229 bcf.
This year Excelerate Energy LLC commissioned its Gulf Gateway Energy Bridge deepwater LNG port in the Gulf of Mexico 116 miles off Louisiana in 298 ft of water. The world’s first offshore LNG receiving port, it is tied into a subsea pipeline that can deliver the gas into the Blue Water and Sea Robin offshore pipeline systems at 50-690 MMcfd (OGJ, Apr. 18, 2005, Newsletter).
US petroleum demand
High prices have not deterred demand for transportation fuels as much as expected in the US. OGJ forecasts increases in the consumption of all oil products this year, mostly tied to the still-growing economy.
Over the 12 months ended Apr. 30, real disposable personal income increased 3.3%, and real consumer spending grew 4.1%, according to the US Department of Commerce’s Bureau of Economic Analysis.
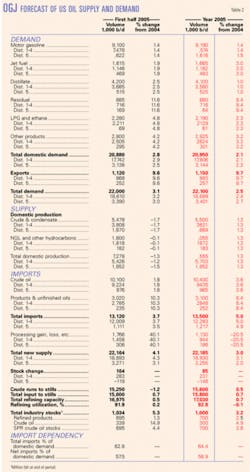
Total oil demand in the US will grow just over 2% to 20.95 million b/d this year, with jet fuel and residual fuel oil consumption gaining the most.
Motor gasoline
US motor gasoline demand will increase 1.4%, the same growth rate as a year ago.
EIA figures indicate that US gasoline prices on June 13 were up an average 14.5% vs. a year earlier, with the biggest gain in the Midwest at 20%. West Coast gasoline prices had gained only 6.3% and California only 4.4% from a year earlier.
Higher retail prices for gasoline may have softened gasoline use so far this year, with demand growth through May at 0.6%, according to the American Petroleum Institute.
Supporting the elevated prices are refiners that have altered refining yields in favor of middle distillates, which have commanded a price premium to gasoline. Even so, gasoline inventories at the end of May stood 4% higher than at the same time a year earlier, according to API.
Jet fuel
Demand for jet fuel will climb 3% this year. Last year’s growth was 2.5%.
Air Transport Association statistics show that airline passenger traffic has finally rebounded to exceed pre-Sept. 11, 2001, levels, although jet fuel consumption has not done so. The trade association for US airlines expects a 4.1% jump in passenger traffic this summer from the same period last year.
Average 2000 jet fuel demand set an annual record at 1.725 million b/d. This year demand will reach 1.665 million b/d on average, as airlines operate at near capacity.
Residual fuel oil
Demand will rise proportionally more for residual fuel oil this year than for any of the other petroleum products. OGJ forecasts that total deliveries of resid will increase 9.5%.
The use of resid, which has declined over the years in favor of cleaner-burning natural gas in the electric power generation sector, has rebounded from a low of 700,000 b/d in 2002 as a result of high gas prices.
Last year resid demand gained more than 4%. But as oil-fired electric generation capacity shrinks, OGJ expects resid use to resume its long-term decline.
Distillate
The use of distillate fuel oil in the US will be little changed from last year, growing 1%. Average demand for distillate set a record last year at 4.06 million b/d.
High-sulfur distillate, used for home heating, will be responsible for less of this year’s growth in demand than will low-sulfur distillate, which is used as highway transport fuel and increases with economic activity. A relatively warm winter limited distillate fuel oil demand early this year, as heating oil consumption declined in January and February from the same 2004 period.
LPG, other products
Demand for LPG and ethane will rise this year by 2.3%.
Last year LPG and ethane demand moved up 3.2% as a result of greater economic activity and the rising need for plastics.
OGJ forecasts that demand for all other petroleum products will climb more than 3% this year. These products include those used in construction projects, including highway construction. This category also includes gasoline blending components, pentanes plus, and unfinished oils.
US oil supply
Total liquids output in the US will increase modestly this year, posting the first such gain in 5 years. Production of crude, condensate, NGL, and other liquids will grow 1.3%.
Alaskan oil production continues to decline. EIA estimates that last year, field production in that state averaged 908,000 b/d, down from average 2003 production of 974,000 b/d.
North Slope production last year averaged 886,000 b/d vs. 930,000 b/d in 2003. Output from this area fell from a high of 955,000 b/d in March 2004 to 679,000 b/d in August but picked up in the final quarter to average 921,000 b/d for those 3 months.
Oil production in the Lower 48 declined almost 4% last year to average 4.52 million b/d, according to EIA.
Estimates indicate that federal Gulf of Mexico crude oil production fell 11% in 2004, averaging 1.44 million b/d.
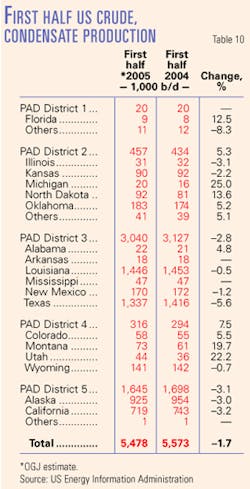
EIA estimates that total US crude and condensate production declined to 5.43 million b/d last year from 5.68 million b/d in 2003 and from 5.73 million b/d in 2002.
High NGL prices generally spur production of liquids-especially propane, which competes with naphtha and gas oil as olefins plant feedstocks.
US NGL and other liquids production this year will climb to 2.055 million b/d from 2.028 million b/d last year.
Imports
Total US imports of crude and products will increase almost 5% this year, weighted heavily on the products side as a result of strong demand for residual fuel oil and gasoline. Last year, imports increased at about the same rate as OGJ forecasts for 2005. Imports for the Strategic Petroleum Reserve will remain nil; the Department of Energy is using federal royalty oil to take SPR to the capacity level of 700 million bbl, scheduled to be reached in August.
Crude imports will grow 3.6% this year, OGJ forecasts. This will bring the average to 10.4 million b/d.
Product imports will average 3.1 million b/d, up more than 8% from last year. Through the first 5 months of 2005, gross product imports were up 11%. Imports of products for Petroleum Administration for Defense Dist. 5, which includes California, last year soared almost 21% year-on-year.
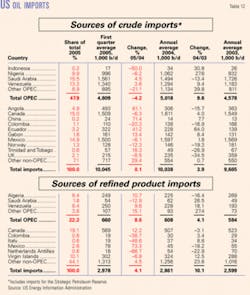
The source of the most crude oil last year was Canada, from which the US imported an average 1.61 million b/d. The second largest source of US crude imports last year was Mexico, followed by Saudi Arabia, Venezuela, and Nigeria.
Canada was also the source of the largest volume of oil product imports during 2004, with the US Virgin Islands, Algeria, Venezuela, and Russia following.
Inventories
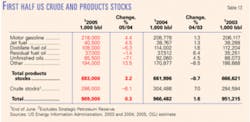
EIA on June 15 released figures showing that US crude oil inventories declined 1.8 million bbl for the week ended June 10 but remained almost 9% above their year-earlier level.
Most product stocks through the middle of June were near and slightly higher than their year-earlier levels, EIA said. Gasoline inventories were up about 6%, jet fuel stocks were up 7%, and distillate fuel oil inventories were about 1% higher that a year earlier through mid-June. Residual fuel oil inventories were nearly unchanged year-on-year.
Stronger demand reduced the number of days of supply that these stocks could cover.
FBR’s Rousseau commented last month: “Distillate prices and margins have surged past gasoline on concerns that there will not be adequate supply to meet demand later in the year. Currently, distillate inventories are 110 million bbl, which equals 26.5 days of forward demand cover, below the average level in recent years of 27.5 days. However, it would only take an increase of 5.8 million bbl for inventories to reach this average level, and given that distillate inventories have risen 6.4 million barrels over the past 4 weeks, we expect them to return to normal before winter.”
Refining
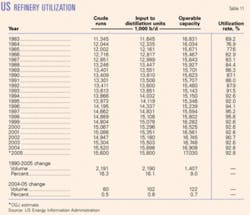
OGJ expects 2005 US refinery operations to run at about the same rate as last year. Inputs and capacity will each move up less than 1%, leaving capacity utilization unchanged at 92.8%.
Operable capacity for all US refineries was 16.908 million b/d last year, according to API. OGJ forecasts that capacity will increase to average of 17.03 million b/d for the year.
The average refiners’ acquisition cost of crude will increase to $45/bbl this year, OGJ estimates, from $36.97/bbl a year ago and $28.53/bbl the prior year.
Refining margins, according to Muse, Stancil & Co., soared last year in all of the major world refining centers and have maintained their strength so far this year in the US.
The US Gulf Coast refining margin averaged $6.50/bbl last year, up from $3.23/bbl a year earlier. Through the first 5 months of this year, the margin averaged $10.53/bbl.
The US West Coast margin followed the same pattern, averaging $12.45/bbl last year vs. 5.80/bbl in 2003. For the first 5 months of 2005, the West Coast margin averaged $16.33/bbl, peaking in April to average $20.86/bbl. ✦
