Price-supply curve explains US production below 1970s’ peaks
Even with much higher prices, neither US oil nor gas production has ever exceeded the peaks attained in the early 1970s. This can be explained with a resource price-supply curve showing the amount of the resource available for a given market price, assuming best available technology, reasonable returns on invested capital, and no political constraints on production.1
Since at least 1935, the market price of petroleum has been set far above the lifting cost of the most competent producers, first by the Texas Railroad Commission and then by the Organization of Petroleum Exporting Countries. Production was limited in order to meet but not exceed demand and maintain prices at the desired level.
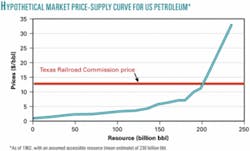
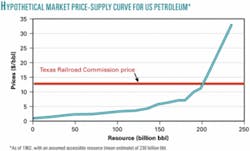
A hypothetical US price-supply curve (see figure) illustrates the effect that setting a monopoly price far above extraction cost would have on production. In this example, 50 billion bbl of oil can be profitably produced at a market price of $2.25/bbl, 100 billion bbl at $3.20/bbl, and 200 billion bbl at $12.50/bbl, the market price set by the Texas Railroad Commission.
The US low-cost domestic resource base was so large relative to demand that for several decades no price increase was necessary. Lower-cost imports from the Middle East allowed this system to function over an even longer period than might otherwise have been possible. However, when the low-cost reserves are finally depleted, prices must rise without any warning much more rapidly than they would without monopoly control. In addition, when prices do begin to rise, there may be a much smaller resource base available; in the example in the figure, only a further 30 billion bbl remains at any price, making the transition to other sources of energy more difficult.
New technologies and higher prices may open up other areas for exploration that were not reflected in the original assessment. This has indeed happened in the US, with resources in the Arctic and beneath first the shallow and then the deep waters of the continental shelf becoming technically and economically available. However, even if this does happen, it is likely that these more inaccessible resources will be able only to maintain production levels or decrease the rate of decline, not continue the exponential increase in production that the market demands.
Prices are not fixed arbitrarily. Ideally, they are set so that consumers can easily afford the product while still providing excellent profits for capable producers. Consumers clearly pay very large premiums over production costs, but given the lack of alternatives and the utility of petroleum, they pay them willingly.
Reference
- Bird, K., Houseknecht, D., “Arctic national wildlife refuge, 1002 area, petroleum assessment, 1998,” including economic analysis, USGS Fact Sheet FS-028-01, 2001. Available at www.usgs.gov.

