The case of Alaska: modeling lease sales in a mature market
In the last 20 years much of the work on oil and gas lease auctions has focused on purely theoretical issues of strategic behavior and ignored many relevant market factors.
The goal of this research was to develop an applied model to explain the variation in pricing of oil and gas leases in a mature market by using data for Alaska’s “conventional” oil and gas lease sales for the years 1984 through 2003.
The original motivation behind this study was to gauge the validity of certain widely held assumptions and ideas about what really impacts these markets. This article outlines these areas of interest and how they link to the variables in the model.
For those unfamiliar with the Alaska lease market, a brief overview of the various lease types, history of lease sales, and a description of the market participants is provided. A formal description of the model is given, followed by the statistical analysis.
Finally, conclusions about the Alaska lease market are presented, along with a brief discussion of the implications for government policy, and specific notes of interest to potential bidders.
Questions, assumptions
Three areas of study were identified: physical characteristics, government factors, and business or market drivers.
Physical characteristics
In a state the size of Alaska, the physical properties of land can vary widely.
So the question is, do regional differences matter? Is land in certain geographic regions more valuable?
And if so, what is the amount of the difference?
The state has historically identified five different sale areas. To investigate these questions each lease sale was reclassified into one of two geographic regions:
1. The North Slope Region, which includes the following sale areas: Beaufort Sea, North Slope, and North Slope Foothills.
2. Outside the North Slope Region, which includes the sale areas of Cook Inlet and Bristol Bay.
A criticism of areawide leasing is that “the large increase in the supply of leases offered in each sale causes bidding firms’ interest to be diffused over many more tracts, leading to a decline in the number of bids per tract and the lease price.”1
The main counterargument is that lower bid amounts are the result of declining interest in an area as the best leases have already been purchased. Because quantifying the impact of areawide leasing is problematic, the counterargument was used to determine the variable of interest. The total acres leased to date in the two geographic regions were determined for each lease sale.
Government factors
The state’s lease sales have included various combinations of fixed and variable bid components, including royalty shares and net profit shares.
These terms directly impact the expected present value of the lease. The question then is: To what extent do changes in these terms affect bidding behavior?
The lease terms generally involve an obligation to make royalty payments as a percentage of gross production to be paid either in-kind or in-value. The minimum royalty is 12.5%, but the state has imposed royalty rates as high as 20%.
For each lease sale the royalty rate was identified as either the minimum royalty rate (equal to 12.5%), or as other than the minimum royalty rate (greater than 12.5%).
In several sales, the state has offered acreage that included both a fixed royalty rate and a fixed net profit share (NPS) component. Under this mechanism, the leaseholder pays a fixed portion of the net profits to the state, where net profits are defined as revenues from production less investments and operating costs.
Since the NPS rate has no minimum and is lease specific, an indicator variable was used to denote when an NPS rate had been imposed.
Business or market drivers
In a common-value auction, the bidder’s estimate of value depends on how he perceives the correlation between observed variables and the value of the lease.2
One of those observed variables is the price of oil. The oil market is one of the most organized and reported commodity markets in the world. So clearly the bidders of Alaska’s leases are aware of the news and information regarding the oil markets.
How does this information affect bidding behavior? For the 3 months immediately preceding each lease sale, a calculation was made to determine the 3-month average of real (adjusted for inflation) Alaska North Slope crude spot prices.
Finally, most companies set budgets for capital or investment activities on a calendar basis. If these budgets act as a true constraint, then as the budget is spent over the year less money is available for investment in the fourth quarter. This constraint could have important implications for the state in setting its schedule for proposed lease sales.
For each lease sale, an indicator variable was used to denote whether or not the sale occurred in the fourth quarter (October through December) of a given year.
Market background
Oil and gas leases are the first step in the exploration and development of Alaska’s resources from which the state generates nearly 80% of its revenue.3
This program is administered by the State of Alaska, Department of Natural Resources, Division of Oil & Gas. The State of Alaska’s Oil & Gas Leasing Program is divided into three basic categories:
1. Conventional oil and gas leases
The most commonly used bid variable for determining the award of acreage is the cash bonus (dollars bid). In 1997, the state changed its leasing methodology to annual areawide leasing. The term “conventional” is arbitrary and is used to make a clear distinction between this lease type and the other lease programs.
2. Exploration licensing
An exploration license holder has an exclusive right for up to 10 years. A license is awarded based on a commitment for exploration expenditures. Upon completion of the commitment, the licensee has an exclusive right to convert any portion of the licensed area into conventional oil and gas leases.
3. Shallow natural gas leasing
The program allows for noncompetitive leases to explore and develop natural gas reservoirs that are located within 3,000 ft of the surface.
Focus on conventional oil and gas lease sales
Competitive lease sales
The conventional oil and gas leases have been allocated under a competitive lease sale program.3 4
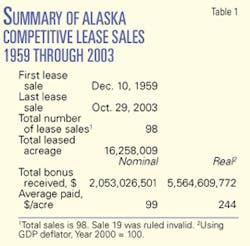
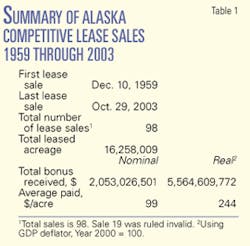
On Dec. 10, 1959, the state conducted its first competitive lease sale. During 1959 through 2003, the state conducted 98 competitive lease sales in which over 16 million acres were leased, generating more than $5.5 billion (real 2000 dollars) in revenue (Table 1).
For the purpose of modeling lease sales in a mature market, the data set was limited to lease sales during the years 1984 through 2003.
By May 1984, the first lease sale in the limited data set, Alaska had already conducted 48 lease sales, the Prudhoe Bay field discovery had been in production for many years, and the Trans-Alaska Pipeline System (TAPS) had been operating for about 7 years. By the end of 1983, annual oil production had reached over 625 million bbl, and cumulative production was over 4.3 billion bbl.
So while it can be said that the determination of market maturity is arbitrary, these events seem sufficient to support this conclusion.
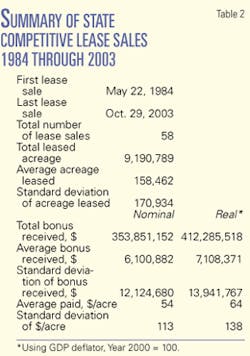
In 1984 through 2003, Alaska conducted 58 competitive lease sales in which nearly 9.2 million acres were leased, generating more than $412 million (real 2000 dollars) in revenue.
The variance among these lease sales is quite large in terms of both acreage and dollars (Table 2).
The average acreage leased is 158,462. However, 45% of the sales were for less than 100,000 acres, and 74% were for less than 200,000 acres.
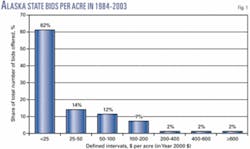
The average bonus received was $7,108,371 (real dollars). In contrast, most of the bonuses received were relatively small-36% of the sales resulted in less than $1 million in real bonus dollars received, with 70% less than $5 million (real dollars). Finally, the average price per acre was $64 (real dollars), with 76% of all sales for less than $50/acre in real dollars (Fig. 1).
Current players
An interesting facet of this market is the diversity of ownership.
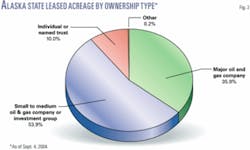
Using data from the Department of Natural Resources website, as of Sept. 4, 2004, the ownership of Alaska oil and gas leases is broken down into various ownership types (Fig. 2).
The major oil and gas companies (firms with market capitalization greater than $50 billion) account for only 36% of the total acreage.
Participation by small to medium oil and gas companies or investment groups (many of which are formed for the sole purpose of purchasing leases) account for the largest share of total ownership at nearly 54%.
What is especially surprising is that individuals or trusts in the name of individuals hold over 10% of Alaska’s oil and gas leases. Finally, others include several Alaska native corporations and small holdings by government entities, which total less than 1% of all leases.
The model
The statistical analysis of conventional lease sales was completed using multiple linear regression modeling.5
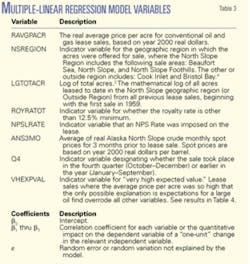
In this case the real average price per acre (RAVGPACR) during 1984 through 2003 is modeled as a linear combination of independent variables (Table 3).
RAVGPACR = β0 + β1 (NSREGION) + β2 (LGTOTACR) + β3 (ROYRATEOT) + β4 (NPSLRATE) + β5 (ANS3MO) + β6 (Q4) + β7 (VHEXPVAL) + ε
Results and discussion
In the data set of lease sales for 1984 through 2003, there are three very large outliers among the dependent variable.
RAVGPACR for the all the lease sales was $63.76/acre. However the three largest values had averages of $857.85, $523.02, and $363.58. To account for the effect of these large outliers the dummy variable very high expected value (VHEXPVAL) was included.
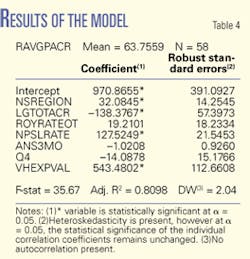
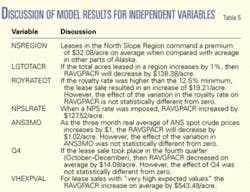
In other words, the very high expected value of the acreage from these sales was the result of factors not in the model such as seismic data, proximity to existing oil fields, or knowledge of similar geological formations, etc. Results were generated using SAS/STAT 9.1 and have been reproduced in a more accessible format (Tables 4 and 5).
Conclusions, implications
A tale of two markets
When the three largest values of RAVGPACR ($857.85, $523.02, and $363.58) are excluded, the real average price per acre for the data set falls from $63.76 to $35.52, a decrease of over 44%.
The VHEXPVAL of these leases suggests that this leased acreage had characteristics that are fundamentally different from all others in the data set. Simply put, the Alaska oil and gas lease market consists of two separate markets:
A. Leases with high expected value or perceived as high production potential, and
B. Leases with low expected value or perceived as low production potential.
Given this assessment, the question remains: Why would anyone bid at lease sales when the leases had a low expected value? There are several possible explanations:
1. Unsophisticated buyers. As of Sept. 4, 2004, 54% of Alaska’s oil and gas leases were owned by small to medium oil and gas companies, and 10% were held by individuals or trusts in the name of individuals. Thus, a majority of the leases are held by bidders with limited resources for technical and financial analysis. Their desire to be “in the game” may be greater than their understanding of the game.
2. Licensing fee and political capital. This explanation would be most relevant to the major oil and gas companies, who believe that purchasing leases for which there is little or no potential for development will demonstrate a “commitment” to the state. This investment, along with other nondevelopment activities such as charitable and political contributions can be viewed as a sort of licensing fee or payment for political capital.
3. Form of insurance. There is always the possibility that acreage that was perceived to be of low value will in fact turn out to have a high production potential. By purchasing additional leases in various locations, a firm is able to insure against this “loss” via diversification of its lease portfolio. After all, no bidder wants to miss the opportunity to participate in the next Prudhoe Bay field.
Government policy
Critics of areawide leasing in Alaska (and perhaps other markets) may have confused coincidence and causality when claiming that this policy has created a decline in lease sale bid values.
Areawide leasing began in 1997, thus impacting lease sales in the last 6 years of the data set. Therefore many people assume that falling bid values in recent years were caused by areawide leasing. However the simultaneous occurrence (coincidence) of these two events does not itself demonstrate causality.
The variable LGTOTACR indicated that as the acres leased in a given geographic region increase by 1%, then RAVGPACR will decrease by $138.38/acre. It is important to note again that the calculation of the acres leased to date began with the first actual lease sale (1959), not just the first lease sale in the data set (1984).
As more acres are leased in a given region the likelihood of a large oil find remaining undiscovered declines, and so will interest in that region. Although these results are certainly not definitive, they do indicate that areawide leasing is not entirely to blame for recently declining bid values.
Often a recommendation is made to halt lease sales during periods of low oil prices in anticipation of lower interest on the part of bidders. The results of the model indicated the effect of the 3-month average ANS spot price was not statistically different from zero. Similar results were obtained using the 6-month average as well as the corresponding averages for WTI.
In all cases, the conclusion was the same, short-run oil market prices do not influence lease sale results. Oil leases are an option on future development; therefore, a rational bidder would ignore current news and events whose impact would have long since diminished to zero by the time the lease would be developed.
The model also indicated that bid values in the fourth quarter were not statistically different from those sales that occurred earlier in the year. Thus there is no expected benefit for the seller, in this case the state, in trying to time its lease sales to maximize the lease price since short-run oil prices do not matter and bidders are not capital-budget constrained.
Notes for bidders
The old adage that the three most important things in real estate are location, location, and location is applicable to the Alaska oil lease market as well.
Historically, the oil fields on the North Slope have been larger and more productive than those in other parts of the state. This fact has not been lost on the bidders of leases, who have paid a premium on average of $32/acre (real 2000 dollars) for leases in the North Slope Region in 1984 through 2003.
As the model demonstrated, the coefficients on the royalty rate and NPSL rates were positive, which is somewhat counterintuitive. These results suggest that as these rates increase the willingness to pay increases, despite the fact that a larger portion of the profit will be returned to the state.
The only rational explanation is that the state imposes these higher rates on leases where the expected economic rents will cover the additional costs to the bidder. In effect, the higher rates act as signal from the seller to the buyer indicating a higher expected value.
Another benefit of the model is that it may be possible for bidders to use recent history to validate the valuation and proposed bid for future lease sales in the same geographic regions.
Lease bids are based on estimates of future revenues, costs, prices, interest rates, etc. One might argue that historical lease sales may not be relevant to such analysis.
By estimating a lease bid using recent lease sales, the valuation is placed in the context of what is already known about the market. If the bid is arbitrarily “high” or “low” based on this type of modeling, it does not invalidate the proposed bid. Rather it sparks a discussion as to why this might be the case and whether or not further research and analysis is warranted. ✦
References
1. Moody, C.E., and Kruvant, W.J., “OCS Leasing Policy and Lease Prices,” Land Economics, Vol. 66, No. 1, February 1990, pp. 30-39.
2. Kagel, John H., and Levi, Dan, “Common Value Auctions and the Winner’s Curse: Lessons from the Economics Laboratory,” Ohio State University, Department of Economics, working papers, October 2001, pp. 1, 3-5.
3. State of Alaska, Department of Natural Resources, Division of Oil & Gas, 2003 Annual Report.
4. State of Alaska, Department of Natural Resources, Division of Oil & Gas, “Five-Year Oil & Gas Leasing Program,” published in 2004.
5. Wooldridge, Jeffrey M., “Introductory Econometrics: A Modern Approach,” 2nd edition, South-Western, Mason, Ohio, 2003, pp. 68-321.
6. Reece, Douglas K., “Competitive Bidding for Offshore Petroleum Leases,” The Bell Journal of Economics, Rand Corp., Santa Monica, Calif., Vol. 9, No. 2, Autumn 1978, pp. 369-384.
The author
David Haas ([email protected]) spent 7 years in the oil industry in Alaska with BP Exploration and Accenture and was also an adjunct lecturer in economics at the University of Alaska, Anchorage. He is a graduate student in economics at Virginia Tech University, Blacksburg, Va. His areas of research include the oil and retail industries and the pricing of industrial goods. He has an MBA and BS in economics from Clemson University.
