New formula yields coking refinery margins more reliably
A new coking-spread formula is a simple, easily applied, and reliable indicator of US Gulf Coast heavy, sour crude coking margins.
Heavy, sour crude coking margins-and not the economics of the few remaining cracking refineries-have had a more significant effect on the economic performance of the US Gulf Coast refining industry in recent years. The traditional 3-2-1 crack-spread formula, therefore, has lost much of its historical utility as an indicator of the economic performance of the refining industry as a whole, and coking refineries in particular.
The coking-spread formula is as an effective replacement for the crack-spread formula; it better reflects today’s refining industry economics.
One can also apply the coking-spread formula to refineries outside the US Gulf Coast. The pricing concepts are generally valid and one can select crude and product prices tailored for a particular market.
In the US West Coast-California market, for example, one can select product prices based on California Air Resources Board specifications and possibly Alaska North Slope or another crude for feedstock costs. Although the coking spread was designed for US Gulf Coast refineries, it can also serve as a accurate overall trend indicator of coking margins throughout the US.
3-2-1 crack spread
For many years, refining industry analysts have used the 3-2-1 crack spread as a broad-based indicator of the economic incentive to convert crude into finished products. Over the years, the 3-2-1 crack spread has become institutionalized as a simple and easily calculated measure of refining margins. Some analysts, however, incorrectly equate it to the current industry’s refining margins-an assumption that is often far from reality.
The theory behind the crack-spread formula is fairly simple. It is grounded in the fact that refineries convert crude oil primarily into two key product classes: gasolines and middle distillates. Broadly speaking, demand for these two classes of products has a ratio of about 2 bbl of gasoline to 1 bbl of middle distillate.
Because gasoline and middle distillates typically comprise more than 80% of a refinery’s yield, this formula seems to offer a simple and reasonable proxy for refining margins. Selecting the appropriate crude oil, product grades, and pricing locations for the crack-spread formula is not as straightforward as it might seem.
When refinery analysts first started using the crack spread, West Texas Intermediate (WTI) crude priced at Cushing, Okla., was one of the most widely traded and price-transparent crude oils in the US marketplace. WTI-Cushing was a logical choice for the crude side of the crack-spread formula.
Likewise, regular-grade unleaded gasoline, which comprised the largest portion of gasoline demand, was a reasonable selection for gasoline in the equation.
Diesel and heating oil were typically sold as a single product and represent the majority of middle distillate demand. No. 2 heating oil (No. 2 fuel oil) was therefore chosen for the middle- distillate portion of the formula. With these inputs, the 3-2-1 crack spread is easily calculated. Table 1 shows a sample calculation based on US Gulf Coast product prices and the WTI-Cushing price for August 2004.
The importance of the 3-2-1 crack-spread formula as a measure of refinery economics increased in the mid-1980s when refiners started to use the oil futures market to hedge price risk. Futures contracts for WTI, unleaded gasoline, and No. 2 heating oil are all traded on the New York Mercantile Exchange (NYMEX) in 1,000-bbl increments.
The crack spread, which uses simple, whole-number relationships, provides an easy and useful method to evaluate the pricing risk between WTI crude, gasoline, and No. 2 heating oil. The crack spread used by financial analysts, conversely, is frequently expressed on a traditional NYMEX basis using product prices for:
• Regular (87 octane) reformulated gasoline delivered to New York harbor.
• No. 2 heating oil (0.2% sulfur) delivered to New York harbor.
The WTI price quoted on the NYMEX is the same as in the US Gulf Coast formula, i.e., delivered to Cushing.
The NYMEX crack spread is a good example of how different variations of the formula can be used in different circumstances and for different purposes. Accordingly, one must exercise some caution in analyzing or relying on data generically termed the “crack spread.”
One must understand the underlying statistics used and the specific formula referred to. In this article, the 3-2-1 crack spread will use US Gulf Coast product prices shown in Table 1.
Cracking refinery configuration, margins
We regularly monitor both short-term changes and long-term trends in refinery feedstocks, refinery configurations, refined product prices, and overall refining industry economic performance. Throughout the years, we have found that the simple 3-2-1 US Gulf Coast crack spread provides a reasonable proxy for the gross refining margin (i.e., the difference between product revenue and feedstock costs on a unit basis) for the typical US Gulf Coast complex cracking refinery.
The “typical” US Gulf Coast complex cracking refinery includes these basic processing units:
• Crude distillation.
• Vacuum distillation.
• Distillate hydrodesulfurization.
• Naphtha hydrodesulfurization.
• Vacuum gas oil hydrodesulfurization.
• Kerosine hydrodesulfurization.
• Catalytic reforming.
• FCC.
• C3-C4 alkylation.
• Light naphtha isomerization.
This type of refinery commonly processes a mix of crudes that are light and sour in quality. Light, sour crudes typically have gravities of 30-35°API and sulfur levels of 1-2%.
Our economic model for a US Gulf Coast complex cracking refinery is based on processing 100% West Texas Sour (WTS) crude. WTS is a light, sour crude with a typical gravity of about 33°API and a sulfur content of about 1.6%. The price of WTS has been quoted in the spot market since the mid-1980s.
Our cracking refinery model calculates finished product yields from WTS based on the process units noted previously. The model also purchases outside unfinished feedstocks, as required, to meet prevailing product specifications.
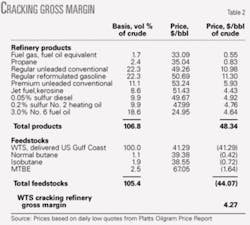
Table 2 shows the WTS cracking refinery yields and a sample calculation of the gross refining margin for August 2004.
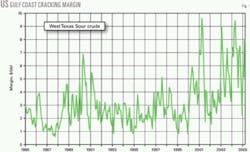
Fig. 1 shows the results of the same calculation, on a monthly basis, for the past 20 years. The average monthly gross refining margin during this entire period was $3.05/bbl, with a high of $9.62/bbl and a low of $0.58/bbl. Although our US Gulf Coast cracking model is based on 100% WTS, the margins calculated from the model represent the gross margins from a typical US Gulf Coast cracking refinery processing a light, sour crude mix.
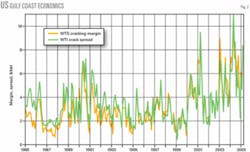
Fig. 2 shows that the 3-2-1 crack-spread formula is, and has historically been, a reasonable proxy for gross margins in US Gulf Coast cracking refineries characterized in our model.
This may be somewhat surprising initially because the product revenue side of the crack-spread formula somewhat overstates the unit revenue actually achieved in the model cracking refinery. The latter produces significant volumes of light ends and low-value heavy fuel oil.
The price discount that WTS crude oil enjoys over WTI, however, almost entirely compensates for (especially recently) this overstatement in revenue. The average calculated crack spread during the entire 20-year period is $3.33/bbl, with a high value of $10.94/bbl and a low of $0.39/bbl.
Conventional statistical analysis shows that the R-squared value is 0.80 for the entire 20 years. This improves to 0.88 when only the most recent 10 years are used; variations in the 3-2-1 crack spread can explain 88% of the variation in the WTS cracking margin.
The improvement in the overall correlation during the past 10 years has been due primarily to the widening differential between the price of WTS and WTI. Recently, this differential has come closer to offsetting the differences on the product value side of the equation.
These calculated R-squared values by no means reflect a perfect correlation; however, they do indicate that the simple US Gulf Coast crack spread is reasonable proxy for US Gulf Coast light sour crude cracking margins.
Coking refinery configuration, margins
Although the traditional US Gulf Coast 3-2-1 crack spread reasonably reflects cracking margins, it shows much less utility with the more complex refineries that have cokers. The usefulness of the crack spread as an indicator of refining industry economic performance has waned considerably in recent years.
The average US Gulf Coast refinery configuration has shifted substantially toward the complex coking refinery that produces a higher proportional yield of valuable products and processes heavy, sour crude.
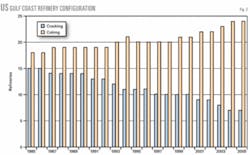
Fig. 3 shows how the number of cracking and coking refineries on the US Gulf Coast has changed in the past 20 years. The number of cracking refineries has fallen by more than half and the number of coking refineries has increased by more than one-third during the same period.
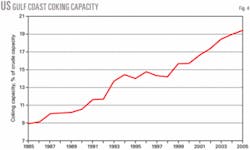
Fig. 4 shows that US Gulf Coast coking capacity, as a percentage of crude capacity, has more than doubled during the past 20 years. US Gulf Coast cracking capacity, measured in the same way, has remained relatively constant during this time.
US Gulf Coast refineries with cokers continue to represent an ever-larger portion of the market. Today, US Gulf Coast coking refineries comprise about 90% of total US Gulf Coast crude capacity and more than 77% of the number of facilities.
Unlike cracking refineries, the economics of coking refineries are driven largely by the light-heavy differential-the prevailing difference in price between light, sweet crude oils and heavy, sour crude oils. The ability to process low-cost crude oils must more than compensate for the coking refinery’s lower liquid product yield, higher operating costs, and the substantial additional capital investment required.
Because the traditional 3-2-1 crack spread does not take the light-heavy differential into account, it is not a very meaningful economic benchmark for these high-conversion plants.
We track the economic performance of the typical US Gulf Coast coking refinery using an in-house refinery model that incorporates process units similar to those used in the cracking model, with the addition of a delayed coking unit.
In the coking model, both the process unit capacities and severities are adjusted to produce a slate of products similar in proportion and quality to the cracking configuration. The coking refinery produces no residual fuel oil, except for a small amount of decant oil produced from the FCCU.
Our US Gulf Coast coking refinery model is based on processing 100% Mexican Maya crude. Since the early 1990s, Maya crude has been the benchmark heavy sour crude on the US Gulf Coast. Pemex currently prices Maya crude for US Gulf Coast deliveries by adding prices for WTS (40%), 3% sulfur No. 6 fuel oil (40%), Louisiana light sweet crude (10%), and dated Brent crude (10%), and taking off a monthly price discount.
Although most Maya crude oil is purchased under long-term contracts, many industry analysts and traders use the Maya formula and believe that it reflects the current value of heavy, sour crude of this quality.
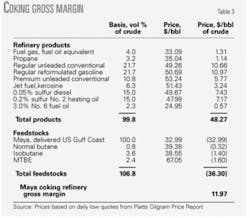
Table 3 shows the Maya coking refinery yields and a sample calculation of the gross refining margin for August 2004. Values for petroleum coke and sulfur are ignored in this calculation for simplicity and because they tend to have minimal economic impact during most time periods.
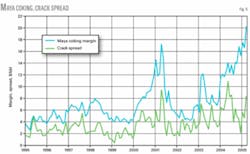
Fig. 5 shows the results of the same calculation, on a monthly basis, for the past 10 years. The average monthly gross refining margin for the US Gulf Coast coking refinery during this 10-year period was $7.09/bbl with a high of $17.14/bbl and a low of $2.51/bbl. The US Gulf Coast model coking refinery had an average gross refining margin of about $3.45/bbl more than the cracking refinery during 1995-2004.
Fig. 5 also shows the wide disparity between the traditional 3-2-1 crack spread and Maya coking margins since 1995. This was particularly pronounced during the last half of 2004, when the 3-2-1 crack spread and the Maya coking margin diverged from a $4.00/bbl difference to more than a $13.00/bbl difference.
For the entire 10-year period, the US Gulf Coast Maya coking margin averaged $3.63/bbl more than the average of crack spread of $3.46/bbl. This shows that coking refineries processing low-cost, heavy, sour crudes enjoy a competitive advantage.
The US Gulf Coast coking refinery data reinforce the fact that the traditional 3-2-1 crack spread is a poor indicator of refining margins achieved by US Gulf Coast coking refineries.
A simple proxy for coking margins
Our relatively simple and reliable substitute for the traditional crack spread called the “coking spread” is much more indicative of the gross refining margins achieved in US Gulf Coast coking refineries that today comprise the bulk of the US Gulf Coast refining industry.
Our primary goals in seeking out a possible substitute for the crack spread were to find an alternative that:
• Reasonably tracked the margins determined in our US Gulf Coast coking refinery model.
• Was relatively simple from a mathematical standpoint.
• Was based on price quotations readily available from oil-pricing services.
• Accounted for the important crude cost advantage enjoyed by coking refineries.
Our first step in developing the formula was to consider the feedstock side of the equation. Because our US Gulf Coast coking model uses Maya as its sole crude feedstock, we carefully considered the various components of the Maya pricing formula and analyzed the effects of different feedstock combinations and ratios on the calculated results.
After considering many possibilities and applying statistical analysis to each, we chose a simple combination of three feedstocks for the crude oil side of the equation: 1 bbl of WTS, 1 bbl of dated Brent, and 1 bbl of No. 6 fuel oil (3% sulfur). Although No. 6 fuel oil is a product and not a feedstock, it comprises 40% of the Maya pricing formula and many heavy crude refiners are equipped to process it as an alternate feedstock.
For the product side of the equation, we followed generally the same pattern in reviewing various product combinations and determining whether they improved the formula’s accuracy. Because coking refineries often tend to make proportionally more middle distillate product than cracking refineries, we finally settled on equal volumes of regular unleaded gasoline and No. 2 heating oil for the product side of the equation.
The final coking spread in $/bbl and based on US Gulf Coast product pricing is calculated thusly:
+ 0.5 × regular unleaded conventional gasoline.
+ 0.5 × No. 2 heating oil, 0.2% sulfur.
- 0.33 × WTS-Midland crude.
- 0.33 × dated Brent crude.
- 0.33 × No. 6 fuel oil, 3.0% sulfur.
Table 4 shows a sample calculation of the coking spread based on product prices on the US Gulf Coast and feedstock prices for August 2004.
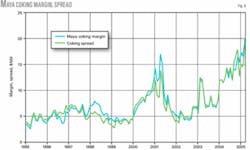
Fig. 6 compares the US Gulf Coast coking spread to the US Gulf Coast Maya coking margin for the past 10 years.
Statistical analysis for this period gives an R-squared of 0.89, which is essentially the same result for the crack spread vs. the cracking margin. This means that the coking-spread formula appears to be as good a proxy for US Gulf Coast coking margins as the crack spread is for US Gulf Coast cracking margins.
The average calculated coking spread for the past 10 years is $6.89/bbl vs. $7.09/bbl for the coking margin-a difference of less than 3%. Also during the past 10 years, the highest calculated coking spread was $17.99/bbl vs. $17.14/bbl for coking margins. The lowest coking spread was $2.77/bbl vs. $2.51/bbl for coking margins.
These results indicate that the coking spread represents an excellent proxy for US Gulf Coast coking gross margins when the refineries are processing heavy sour crudes.
Like the traditional crack spread, one of the benefits of the coking-spread formula is that it can also be used for price risk hedging. This is because all of the variables used in the formula have a comparable futures contract that is available from NYMEX. ✦
The authors
John B. O’Brien (jbo@bak- erobrien.com) is the president of Baker & O’Brien Inc., Dallas, an energy consulting firm he co-founded with Kenneth Baker in 1993. He has nearly 40 years’ experience working in or consulting for the downstream petroleum industry. O’Brien worked for Caltex Petroleum Corp. before starting his consulting career in 1975. He holds BS and MS degrees in chemical engineering from Massachusetts Institute of Technology and is a registered Professional Engineer in Texas.
Scott D. Jensen ([email protected]) is a senior consultant at Baker & O’Brien Inc., Dallas. He has 30 years’ experience in the petroleum refining and chemical process industries and has been consulting since 1991. Before becoming a consultant, he served as refinery manager at Coastal Oil & Gas Corp.’s Wichita, Kan., refinery. Jensen specializes in process plant evaluations, project feasibility studies, plant start-ups, process optimization, and refinery economic evaluations. He holds a BS in chemical engineering from Purdue University and an MBA from Corpus Christi State University.


