OEE method improves condition-based maintenance
Overall equipment effectiveness (OEE) combines operations, maintenance, and quality measurements in a single key performance indicator and is an objective way of collecting the lifecycle performance of processing equipment.
Variations in OEE for a piece of equipment directly relate to the business performance of a plant. The events and responses to those variations can be used to turn condition-monitoring data into valuable maintenance, reliability, and safety information.
Maintenance programs
The challenge with many reliability programs is that they are difficult to relate to the financial performance of a business.
Completely preventative maintenance programs provide for a safety-based approach to equipment reliability, but no program can guarantee against failure 100% of the time. Additionally, it is hard to relate preventative-maintenance programs to successful incident avoidance or to safety, environmental, or operational directives.
Run-to-fail maintenance programs emphasize production instead of equipment condition. They are unacceptable from safety and environmental points of view and are uneconomic because the requirements to staff response teams and maintain spare-part inventory close to the failure site increase significantly as the production environment becomes harsher.
Condition-based monitoring CBM is an alternative to these two extremes. CBM uses information collected about a piece of equipment from the day of its purchase, including calibration and work order activities, regular in-line maintenance and testing, as well as detailed engineering models of how that equipment should operate.
In the absence of objective criteria to understand the tradeoffs between decisions made in a maintenance environment by the maintenance staff and those made in a production environment by production personnel, many plant managers see their reliability programs reduced due to aggressive cost-cutting in lean times and unjustified spending after a major outage or safety or environmental incident.
OEE
Used in discrete manufacturing industries, such as semiconductor and automotive-part manufacturing, OEE provides an objective method to link three key performance indicators: availability, production, and quality or yield.
OEE can be expressed simply: (yield × throughput × availability)/the theoretical maximum.
Measurements for each pump, compressor, tower, or turbine in a plant can be calculated and trended. The measurements for the entire plant result from combining pieces of equipment into groups and averaging the measurements for each in the group.
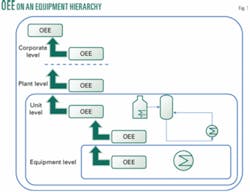
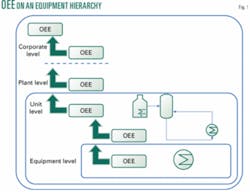
For this, a plant model is useful; it should divide the plant into a logical, layered model called an asset hierarchy (Fig. 1). The asset hierarchy is just a way of logically grouping together pieces of equipment that makes operational sense in the plant.
For example, a reboiler consists of a pump and heat exchanger. A separation column consists of a column, reboiler, and reflux drum. The separation column is part of a larger operational unit. The hierarchy arranges the plant in a way that makes sense to plant personnel. The hierarchy for operations could be different from the one for maintenance and other departments.
OEE can use an operations asset hierarchy specified by accepted industry standards, such as ISA-95.1 The asset hierarchy can then be used to navigate or drill down into the plant to uncover more details. OEE provides a way for plant managers to see the impact of CBM decisions on production performance and vice-versa.
Variations in OEE indices for a particular piece of equipment can be analyzed to yield an understanding of the impact of all operational decisions on that piece of equipment.
Trending OEE and contributing measurements allows each department to have a single number to follow; it helps it understand the impact on overall performance from the decisions each team makes. OEE applied to either one or more plants or products provides a simple yet effective way of tracking the trade-offs between operational and maintenance decisions.
Three measurements
Each OEE measurement consists of a theoretical maximum and a measured, or calculated, actual.
Availability is the fraction of scheduled time a piece of equipment is unavailable for use. It is usually measured by capturing downtime events and durations and rolling up the statistic over a period of time or plant run.
Production is the fraction of an asset’s actual production rate for a given product divided by the theoretical production rate, as specified by the design criteria for an asset or some online theoretical calculation or engineering model.
Quality or yield is the fraction of production that meets specification divided by the process theoretical maximum given by some theoretical calculation or engineering model
OEE for each equipment is simply the product of the three measurements. It is dimensionless and always less than 100%.
The key is to calculate the measurements for each asset in a processing plant. This practice allows one to combine the measurements for groups of equipment by area, type, or any other criterion so that operational decisions and events that have a large impact on the process can be analyzed.
OEE provides a visible indication of the health of a particular piece of equipment and quickly shows the hidden costs in one or more assets and reveals improvement opportunities.
Plant personnel can then log and collect data on each event that causes a significant change in OEE for a piece of equipment. Assigning reason codes for events generates a record of performance for each asset during its lifecycle.
These can be analyzed with traditional statistical quality control techniques such as a Pareto chart, which helps personnel understand how the equipment performs. Pareto charts sort the causes of variations in OEE, which shows the most common causes of the variations. Analysis of the most common causes helps reveal significant and persistent deficits in yield, operations, or maintenance.
OEE provides a framework for collecting performance data for maintenance, operations, and engineering activities, and also a way to collect and analyze responses to performance variations by the process, control equipment, and various teams managing the field.
Engineering models
Plant personnel can build two of the three factors in OEE by using calculations or advanced engineering models, which can predict how a piece of equipment should perform under ideal conditions and when it makes sense to do so.
OEE provides a framework for introducing models to the production data and uses them to construct a measurement that can then be used in the daily operations. For example, an engineering model of an effluent compressor, which accurately predicts blade fouling, can provide an up-to-date theoretical production rate for the denominator of the production factor for the compressor.
As the process data on the compressor change, so does the contribution of the production factor to the OEE for the compressor.
When it is not economic or useful to use a complex engineering model for a theoretical production or yield factor, a simple linear equation may suffice; an empirical or inferred model can also be used. The value is that the process engineering theoretical performance is combined with actual process results and can be analyzed in combination with maintenance activities.
Six causes of performance losses
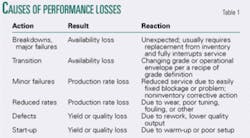
For the three OEE factors-availability, production, and yield-there are six major causes which provide the basis to collect information for Pareto analysis. Table 1 shows each cause, defines it, and links it to each factor.
Assets, OEE
The definition of an asset to monitor with OEE can be as elastic as makes sense. An asset is some capital investment or equipment that is part of the process: if it is not running, performing at lower rates than designed, or producing poor yields, then it is not performing optimally per the investment made.
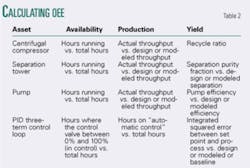
In this loose definition, personnel need only to identify how to evaluate the three measurements of OEE: availability, yield, and production for each asset. Table 2 shows some examples.
How to use OEE
Because OEE is dimensionless, trending it over time provides a way to benchmark various areas of the plant against each other, as well as time periods against themselves.
It is important to examine how these measurements change over time for each asset and how events and responses to other events change these measurements. Over time, these measurements establish themselves as benchmarks for how equipment runs when running well and poorly. This history then becomes useful for analyzing over the lifecycle of the equipment.
A compressor, for example, may show a higher-than-normal vibration. One response may be to reduce the overall loading on the compressor or perhaps shut it down to make an adjustment or realignment. This decision should show up in both the production and availability factor of OEE for that compressor and be visible in a trend of the overall measurement and in the factors that make up that measurement.
Capturing the evaluation and response to this decision then forms part of the life-cycle history of that compressor. The value of the tradeoff made is stored with the life-cycle record and can be referred to in subsequent cases.
OEE measurements for similar pieces of equipment can be benchmarked against each other to discover best practices and incipient issues before they may affect operations. In CBM programs, a history of OEE measurements for a piece of equipment can be used to provide a baseline for good condition. From that baseline, variations in the OEE measurements can define certain workflows as part of a CBM program.
The capture, alerting, analysis, dispatch, and resolution of CBM events all change the OEE measurement; therefore, the contribution of that CBM event response now applies to overall plant performance.
Advanced reliability solutions
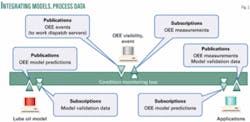
Combining OEE with advanced enterprise-integration products allows maintenance, production, and business systems to integrate into a performance-management solution.
This solution objectively considers spare-part inventory, maintenance-team readiness, equipment condition, and production needs. OEE turns CBM into a valuable tool because the effects of CBM activities on production and process engineering are visible and shared among all staff.
Linking overall production measurements to OEE events begins the difficult task of relating profitability to operational decision-making.
Fig. 2 shows this integration.
Advanced reliability programs, even across many disparate systems, are possible with standards to define and manage CBM data and workflows.
Emerging standards such as ISA-95 and MIMOSA enable collaboration and integration of vibration systems, process historians, diagnostic engines, work order dispatch, and spare-part management systems.1 2 The goal of these collaborations is to use lifecycle data about plant assets by automating the processes that manage their reliability.
Example application
Compressor systems in a refinery are often critical pieces of equipment that must be designed and maintained properly to ensure safe, reliable, and optimized production in the unit or entire plant. Trips in the compressor system can cause major unit shutdowns, safety problems, and loss of production, resulting in reduced operating margins and profits.
A major petroleum company has used dynamic simulation in conjunction with its in-house compressor experts to model the lube oil systems of key compressors in a refinery. Upsets in the refinery often caused the lube oil system to trip the compressors.
The refiner created a dynamic model of the existing lube oil system to explore the system’s response to different potential disturbances. Using the dynamic model, the refiner redesigned the lube oil system to better handle these abnormal operating conditions.
These design changes improved the reliability and online performance of the compressor systems, resulting in savings of $1-1.5 million/year.
This dynamic model of the lube system can now be integrated with the online condition-monitoring systems. Predicted performance of the lube system can represent the design performance of the lube oil system in healthy operating conditions.
When combined with the actual performance now as part of an OEE program, operations, maintenance, and engineering staff can now collaborate objectively on the overall effectiveness of the systems vs. ideal model predictions. ✦
References
1. ISA-95 Enterprise-Control-System Integration, www.isa.org.
2. Machinery Information Management Open Systems Alliance (MIMOSA), www.mimosa.org.
The authors
David Elley is product marketing director for operations management at Aspen Technology Inc., Seattle. He has 19 years of process automation and performance management experience in a variety of process industries including petroleum refining, chemicals, specialty chemicals, and pharmaceuticals. Elley has been with Aspen Technology for 10 years as a project manager for large manufacturing execution systems projects and as a product manager for Aspen’s performance management product line.
Glenn Dissinger is a business consultant for Aspen Technology Inc., Houston. He has more than 20 years’ experience in the management, business development, and application of mathematical models and computer simulation technology for operating and process simulation software companies. He rejoined AspenTech in May 2002 with its acquisition of Hyprotech, where he served as manager of the regional product managers for the Americas region. Dissinger holds a BS, MS, and PhD in chemical engineering from Lehigh University, Pennsylvania.
