Venezuela marine terminal expanded with bottom-pull method
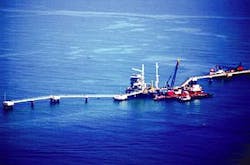
Willbros International Inc.’s unit Constructora CAMSA SA used the bottom pull method recently to install pipelines in the expansion of an existing sea-island marine shipping terminal. The work was for the Ameriven TAEJ Hamaca project at the Jose Petrochemical Complex, Jose, Venezuela.
The expansion added a southern berth which included:
• Substructure.
• Deck with three 16-in. loading arms.
• Pigging and metering facilities.
• Control room.
• 6-km long, 36-in. OD pipeline.
• 6-km long, 20-in. OD pipeline to shore.
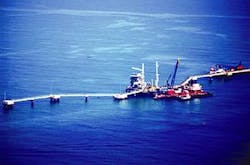
The loading berth is in 80 ft of water (Fig. 1).
This article describes the pulling portion of the installation of the pipelines from the beach foreshore to the offshore riser tie-ins at the base of the platforms.
Vessel shortage
The bottom-pull method was selected for this project because there was a shortage of large diameter pipe-laying vessels in Venezuela. The method also had previously been used successfully for the lines adjacent the site.
With bottom-pull installation, the contractor must balance the pulling loads with the geometry of the site; the soils forecast vs. actual at the site; calculated on-bottom pipe weight vs. actual weight; interaction of the pipe with the soils and resulting coefficient of friction, waves, currents, sea states; and contractual requirements with sound engineering judgment.
The common denominator to bottom pull is the submerged specific gravity of the pipeline. Two conditions must be evaluated: the specific gravity of the pipe during installation and the final in-place specific gravity. Auxiliary buoyancy can be added to the pipelines as required to adjust the pulling forces to dynamically compensate for changed conditions as an alternative merely to increasing the amount of pulling force.
The use of buoyancy must reasonably be applied to achieve and maintain control of the entire string being installed. In shallow water, littoral currents can displace the pipe from the right-of-way. Surfacing or spanning off the bottom of the pipe must be avoided, and as water depth increases during the pull, absorbed ions in the concrete coating and compression of the buoyancy materials must be considered.
A computer model of the majority of the factors can predict, with reasonable accuracy, the expected results of the bottom pull; however, it is important to recognize the breakout loads required to make the final pull.
Time delays that commonly occur between pulls can result in shear strength setting up in the bottom soils. Setup time must be identified and calculated early in the pulling process to enable alternative planning and prepreparation in the event of unexpected delays.
While the final pull load of the last string usually could be expected to be the highest tonnage pull, machinery breakdown, labor issues, or weather actually could precipitate conditions resulting in the highest tonnage pull loads. The computer model allows sufficient time to analyze the pulling process and make adjustments so the buoyancy can be understood and prepared for in a timely manner.
Equipment, services
The majority of marine equipment available for work in Venezuelan waters comes from the conversion of older drilling barges used in the relatively calm waters of Lake Maracaibo. These work barges typically are about 50-ft wide by 135-ft long and provide a stable platform for pulling winches.
Barge-mooring equipment is generally available in-country, but heavy rigging and suitable winches for the pull must be imported. General land construction equipment was available for this project but required preplanning for use inside the plant where staging of the work took place.
Commercial diving equipment was at a premium in the area, and there was a lack of experienced diving personnel.
Good quality hydrographic services and soils engineering were available and were used to assist in the installation.
Pipe pull loads
The vertical weight of the pipeline in the water is calculated by the submerged weight per foot of the pipe multiplied by the final length to be installed. The horizontal pull must be adjusted by applying the coefficient of friction between the surface of the pipe and the surface of the soils in both the static and dynamic conditions.
A part of the coefficient of friction is the tangential shear strength of the bond that develops between the pipe and the subsea soils. The mechanics of the buildup of shear stresses in soils is a very complicated issue that includes time duration and the area of contact.
An assumption can be made on the percentage of the vertical weight that will be converted into the horizontal pull to pull the pipe. The assumption can then be verified at the beginning of the pulling process to ensure that excess means are available for the final pull.
Two lines
There were two pipelines installed in this project. The first was a 36-in. OD x 0.625 WT, X-52 steel line with Polypro cathodic protection, 4.5 in. of 152 lb/cu ft concrete weight coating, with a final pull length of 5,800 m. Submerged empty specific gravity was 1.16. The dry weight of the 36-in. pipeline with the concrete coating was 761 lb/ft (1,141 kg/m). The concrete weight coating has voids that will absorb water once installed on the seabed, and the overall weight of the pipe will increase by 93 lb/ft (139 kg/m).
The second pipeline is a 20-in. OD x 0.50 wall thickness, API 5L X-52 steel, Polypro cathodic protection, with 3 in. of 152 lb/cu ft concrete weight coating, and a final pull length of 5,800 km. The dry weight of the 20-in. pipeline with the concrete coating was 305 lb/ft (458 kg/m). The concrete weight coating has voids that will absorb water once installed on the seabed and the overall weight of the pipe will increase by 64 lb/ft (96 kg/m).
Soil conditions at the site were fine sand with large gravel at the beach and for the first km out from shore. There were fine marine sands 1-3 km offshore and fine marine sands with sticky clay at 3-5 km. There was loose silts with clay beneath at 5-6 km.
The centerline profile at the beach was 2% for the first 100 m and then flattening to 0.5% out to the platform.
Pipeline routing, existing operations
On the east side of the pipeline centerline, four existing 36-in. OD lines ran to the original part of the loading platform. In addition, optical and electrical cables ran along the east side of the route. On the west side of the selected route ran a 24-in. OD pipeline for Orimulsion to a single-point mooring buoy for tanker loading.
Onshore, the staging area was limited because of crowding among facilities inside the existing plant.
The existing terminal exported crude from the plant’s coke stripping operations. The facility could handle large crude tankers (200,000 dwt) which were capable of turning around in 16 hr at the two existing berths at the north platform.
Pipe coating
The concrete weight coating was applied to the pipe at the beach installation site. Application was by an Allan Edwards Inc., Tulsa, process of attaching multiple spacers to welded wire fabric and then applying a thin sheet metal form over the spacers. That was held in place around the pipe with metal bands.
Concrete was then placed inside the forms. The process was labor intensive but allowed the pipe to be coated in place on storage racks. This reduced the handling and the inevitable coating damage from multiple moves of the heavy sections. There is no concrete pipe coating plant in Venezuela.
Specifications called for a heavier-than-normal-density concrete. While it was anticipated that iron ore would be available to increase the density, the supply of iron ore was unreliable. A local aggregate was located to replace the iron ore in the required 152 lb/cu ft concrete. Concrete material availability and supply created schedule concerns.
Pipe string prefabrication
The string fabrication site at the beach limited the length of the pipe strings to 692 ft or 27 sections of each size.
Initially, the drift sands on the beach were capped with 18 in. of clay to provide a working surface for the equipment and personnel. This later proved to be an environmental issue, and the clay was removed during site restoration.
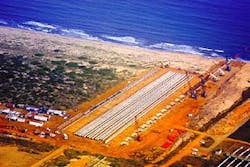
Pipe racks of 12 in. by 12 in. timbers-large enough to hold 27 section of 36-in. pipe and 27 sections of 20-in. pipe-were arranged on the work platform for welding of the pipe, the placing of the concrete-weight coating on the pipe, storing the completed pipe strings, and facilitating movement of the pipe strings to the launch ramp rollers (Fig. 2).
The launch ramp allowed the pipe sections to be joined while the geometry, needed to limit the bending stresses on the pipe strings during transition from piperacks to the launching ramp rollers and the pull into the sea, was controlled.
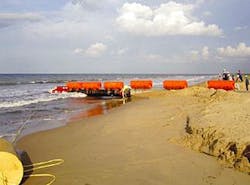
Buoys were attached on the launch ramp while the pipe sections were being joined, positioned, welded, radiographically inspected, and field-joint applications completed (Fig. 3).
Selecting final pull force
Preliminary calculations for the maximum pull loads were based on a saturated submerged weight of 106 lb/ft (159 kg/m) for the 36-in. OD pipe times the 19,140 ft (5,800 m) which resulted in a weight of 1,015 short tons (922 tonnes).
A more refined estimate of the maximum pull was made by breaking down the pull into the following components:
• Effects of the drag of the pipe on the rollers.
• Drag on the pipe from the sand through the beach zone.
• Drag of the pull cable.
• Reduction of the submerged weight due to auxiliary buoyancy.
• Effect of the friction factor of the subsea soils.
The factors considered are shown in Table 1.
The original basic considerations indicated a maximum pull of 345 tonnes considering 530 tonnes of auxiliary buoyancy attached to the pipeline and conservative loads being used in the calculations. The rigging system was then analyzed with 345 used tonnes for the maximum load.
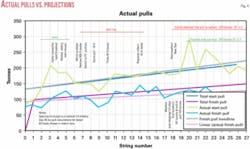
During the process of pulling the pipe strings, the active computer model of the elements was very helpful in ensuring the success of the pull by adjusting auxiliary buoyancy when necessary. The actual start pull and finish pulls and the time between pulls were plotted for each pull and compared to the projections (Fig. 4). As the pull progresses, adjustments can be made in the original basic consideration to predict the most probable final pull. Events can be placed on the chart to help analyze the events that occur during the pull.
Items such as time between pulls, soil-type locations, and trendlines can help picture the overall activities of the pull. The pull barge was anchored to six sets of pin pilings at 1-km intervals. A pin piling was considered the most reliable anchorage to ensure the reaction loads for the pull. The piles were driven a minimum of 5 m below the surface to ensure clearance for any future bottom needs in the area.
The spacing of the pilings was redundant if needed for the pull. Pendant lines with anchor buoys were connected to midpoint pad eyes on the pin pilings to provide the maximum lateral pull from the pilings.
On the deck of the pull barge, two separate anchor winches were used to spool the back anchor wires and to hold the barge against the pulling loads. The barge had a six point barge-mooring system to allow movement along the right-of-way and to set up for each pull.
The main pulling winch was a 400-ton linear winch capable of continuous constant pull. The winch was mounted on the barge with extensive reinforcement into the haul of the pull barge.
A large fairlead was fabricated and placed at the stern of the pull barge to ensure the cable was fed into the winch without misalignment. The cable take-up reel was mounted on the bow of the barge. An electrical load cell and pressure gauges measured the loads being pulled by the winch.
Pull monitoring, buoyancy control
The position of the pull barge was monitored at all times by onboard survey equipment. The pull loads from the pulling winch and the position of the pipe were used in the computer model to validate the pulling process and assure the success of the pulling.
To control the final pulling loads, the spacing of the buoys was changed to reduce the load but not allow the pipe to float off bottom and be laterally displaced. Three types of buoys were used to lighten the pipe during the pulling. First, local 2-m long steel can buoys-previously used in the area-were placed on the leading sections which eventually would be in 24-m water depth.
Next, 12-m long steel can buoys were fabricated and used from the 10-m water depth out to the section with the 2-m buoys. The third type was polyurethane-cast buoys fabricated onsite to provide the balance of the auxiliary buoyancy needed in the shallower waters. The polyurethane buoys had to be restricted to water depth due to compression and absorption at depth; however, the buoys were convenient for casting on site and handling. In addition, an extra 100 tons of air bags were on hand for additional lift if needed.
Bottom pull safety
An area of interest that has been raised in EPC work where the client is the insurance provider relates to the acceptable factors of safety used in bottom-pulling methods. In this project, the contract did not directly specify a factor of safety for the pulling event.
Engineering societies, while addressing a large area of activities, have not engaged in this area due to the limited nature of the specialized projects. Should the client and insurance underwriter become involved, it could create confusion for the contractor. The selection of a safety factor must be the result of analysis of the requirements, and it should follow generally recognized engineering practice.
While a factor of 1.5 is acceptable for many engineered items, structural steel buildings and bridges that are associated with long life spans, the pulling of a pipe on the bottom of the ocean represents a short-life activity and limited risk to personnel. During pulling with certified tested rigging components, a lesser safety factor should be considered acceptable where a cable failure would not be catastrophic to the project.
On this project, the underwriters for the client challenged the safety factors after the rigging had been in place and the pull started. This created a major issue during the pull that was resolved by an increase in the auxiliary buoyancy used during the pull to limit the pull loads to 300 tonnes, implying a safety factor of 1.3 on the pull.
The underwriter and client’s concerns arose from working in the marine environment and not being able to clearly identify all the environmental loads. That refers to safety factors for ocean towing and untested rigging components of questionable origin, but it is not realistic in the pulling method for pipelines.✦
The authors
Windy Hughes is a project manager with Willbros International Inc. and has been involved with three long river pulls in Nigeria before the successful completion of the bottom pull discussed in this article. He holds a BS degree from Clemson University, Clemson, SC, and has an MBA from the University of South Carolina, Columbia, SC. He has worked with Willbros for 12 years, managing various EPC pipeline and facility projects.
Frank B Gibbons (frankbgib- [email protected]) is a private consultant for energy projects. He has over 30 years of corporate, project management, and engineering experience in the pipeline industry. A significant amount of his experience is in wetland and offshore transitional zone pipeline construction in addition to terminal construction. He graduated from the University of Kentucky in 1970 with a BSCE and attended Keller Graduate School in the MBA program in 1988.
