Offshore platform designs need to account properly for elevation changes in the cooling-water systems. The elevation changes directly affect the seawater supply pump’s ability to deliver cooling water to users high above the pump.
The elevation changes also can cause low vacuum pressures at high points unless the system is designed to avoid their formation.
The cases examined in this article hold the seawater system flow characteristics and the pump curve constant while determining system performance with different strategies for managing the elevation changes. Knowledge of these strategies allows the characterization of the seawater system flow and selection of the pump curve for the desired performance.
Seawater cooling
Seawater cooling on offshore platforms cools hot production streams, in interstage coolers for multistage gas compressors, and for various other utility cooling services. The hydraulic design often causes operational problems with these systems if the design neglects to account properly for large elevation changes that are common offshore.
Fig. 1a shows a typical seawater cooling system. One or more seawater pumps transfer water from the sea into a distribution system that directs the seawater to heat exchangers on the platform.
Seawater leaving the heat exchangers is then discharged overboard.
Base case
The hydraulic design and performance of the simple cooling-water system (Fig. 1b) illustrates the effects of various design errors on the system performance.
The base system has one pump and one heat exchanger. The pump discharge flange is 50 ft above sea level, the heat exchanger is 100 ft above sea level, and the system discharge is slightly below sea level.
Four locations in the system are labeled A through D as follows:
• A-Pump discharge nozzle.
• B-Heat exchanger cooling-water inlet nozzle.
• C-Heat exchanger cooling-water outlet nozzle.
• D-Cooling-water discharge.
The assumed design seawater flow rate for the system is 1,000 gpm. As a base line for the system hydraulic design, this case assumes that if there were no elevation changes, the piping and equipment is sized so that the pressure drop at 1,000 gpm is as follows:
• A to B-5 psi.
• B to C-5 psi.
• C to D-5 psi.
Equation 1 (see equation box) provides the hydraulic model for the piping and equipment.
In the equation, the pressure drop is taken from the inlet to the outlet of each segment. Thus ∆PA-B = PA - PB and PB = PA - ∆PA-B. The constant k is calculated with Equation 1 at the design point. For example, kA-B = Q2/∆PA-B = 1,0002/5. Because the pressure drop is the same in each segment, the constant k is also the same for each segment.
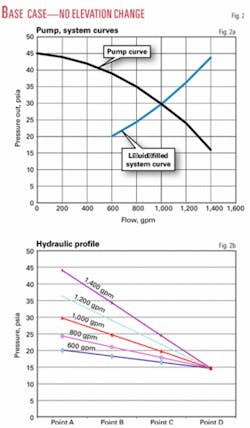
Still assuming no elevation change, one can calculate a system curve and assume a pump curve that intersects the system curve at the design flow rate. Fig. 2a shows the pump and system curves, and Fig. 2b shows the hydraulic profile at each point in the system with various flow rates.
Case 1
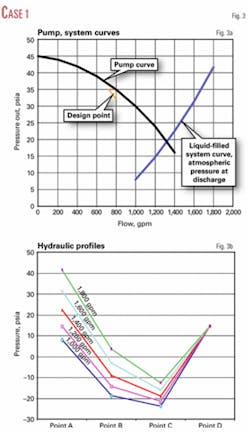
If one assumes that the system is completely liquid filled and that the discharge pressure at Point D is atmospheric pressure (14.7 psia), then the system curve shifts to the right (Fig. 3a). The system apparently can handle a higher flow than the base case because of the overall elevation change from Point A to Point D.
If one assumes the elevation changes as shown in Fig. 1b, the calculated hydraulic profiles of the system (Fig. 3b) reveal a problem. Fig. 3b shows that the calculated pressures at the inlet and outlet of the heat exchanger are less than 0 psia, which is not realistic.
Case 2
The system must maintain the pressure above the vapor pressure of the seawater to keep the system liquid filled. If one assumes that throttling a control valve at Point D maintains the pressure at the heat exchanger outlet at atmospheric pressure, the predicted flow shifts to the left of the base-case design point.
Fig 4a shows the resulting pump and system curves and also shows the pressure required at Point D to achieve this performance.
Fig. 4b shows the hydraulic profiles for Case 2. The hydraulic profiles for Case 2 are the same profiles as in Case 1 shifted upward so that the pressure at Point C is 14.7 psia. Fig. 4c illustrates the hydraulic profiles for Case 1 and 2 for 1,000 gpm.
An obvious problem can arise if the heat-exchanger elevation above the pump discharge is greater than the discharge head of the pump at its shut-off point. Circulation through the system may not be possible if this occurs.
It may be possible to start the system by completely liquid filling it in a static condition and then starting the pump. If the pressure in the system never falls below the water vapor pressure, a siphon will form and parts of the system will operate below atmospheric pressure.
Minimum operating pressure
Operating pressures below atmospheric are feasible if the piping and equipment are designed for them. The operating pressure in an offshore platform seawater system is often slightly less than atmospheric but more than the vapor pressure of water. If the pressure falls to less than the vapor pressure of water, the system may have problems with cavitation and the occurrence of water hammer.
Throttling the discharge end of the system, as discussed in Case 2, can maintain the pressure at the high point in a system. Often the design includes a restriction orifice near the discharge end of the system for this purpose. Using a restriction orifice is feasible only if the seawater flow rate remains fairly constant. If the seawater flow rate varies significantly, the restriction orifice will not be effective at low flows and will generate too much pressure drop at higher flows.
The venting of the seawater discharge line directly to the atmosphere is another method for maintaining pressure in the system (Figs. 1c and 1d).
The figures show several details that are important for proper system performance. The piping system must have an arrangement such that the exchanger seawater outlet line ties into the seawater discharge line above the heat exchanger. This ensures that the seawater side of the heat exchanger always operates full of liquid.
The figures also show that the atmospheric vent elevation is above the pump shut-off head. This prevents water from leaving the vent if an obstruction forms in the discharge line. It is not always necessary or possible to locate the vent at this elevation. In these cases, it is imperative that the seawater discharge line be sized properly to prevent water backup in the vent.
One should base the seawater outlet line size on methods used for open drain-line sizing rather than on methods used for circulation-line sizing. Typically a cooling-water supply line is sized for a frictional pressure drop of about 1 psi/100 ft with a liquid-full velocity of about 5-10 fps.
A properly sized seawater outlet line can operate 50-75% liquid full and have a frictional pressure drop of 2-6 in. of H2O/100 ft.
The diameter of a properly sized seawater discharge line is typically one or two nominal pipe sizes larger than the main seawater supply line.
Fig. 1c shows a simple cooling-water system with a single heat exchanger. In this case, the atmospheric vent is simply an extension of the vent line above the heat exchanger’s water outlet line with the vent the same size as the liquid outlet line.
Fig. 1d shows a more complex cooling-water system with exchangers on three separate levels. In this case, the seawater outlet line is sized for the appropriate flow in each segment, and a separate vent line connects the high point of the seawater outlet lines on each level.
During operations, the frictional head loss in the seawater outlet line is much less than the hydrostatic head of a water column from the top of the seawater outlet line to sea level. As water falls in the seawater outlet line, a vacuum forms at the top of the outlet line and draws air in through the vent.
The vent lines in both Figs. 1c and 1d must be adequately sized to account for the ingress of air that occurs during operations.
The required size for the vent line is always much smaller than the seawater outlet line. Typically a 2-in. vent line is adequate for seawater outlet lines as large as 12-in. and a 4-in. vent line is adequate for a 20-in. seawater outlet line. The proper size of the vent line depends on the seawater flow rates and the elevation changes involved. Calculations should verify the size.
Installation of an air-release valve or vacuum breaker at the high points of the system is a third method of maintaining the pressure in the system. This valve allows air to flow into the system if the pressure falls to less than atmospheric. Fig. 5a shows a cross-section of a typical air-release valve, and Figs. 5b and 5c show the valve’s operational characteristics.
The seawater piping connects to the bottom port of the air-release valve. The top port of the air-release valve is open to the atmosphere. When there is sufficient water pressure in the piping system, water fills the air-release valve and lifts a float inside the valve. The float closes the top port and prevents water flowing to the atmosphere. If the pressure in the water piping falls below atmospheric, air enters the top port and flows through the valve and into the seawater piping.
Figs. 1e and 1f show typical seawater cooling-system configurations with air- release valves. With air-release valves, the same considerations apply that were discussed previously for keeping the seawater side of the heat exchangers full of liquid.
The use of air-release valves rather than an open vent has advantages and disadvantages. One advantage is that for complex seawater systems, these valves eliminate the vent piping system. A second advantage is that the seawater outlet line does not need to be sized as an open drain line and thus may have a smaller diameter than if an open vent were used. If air-release valves are used, however, it is imperative that the valves and the size of the seawater outlet lines account properly for the air ingress that will occur during operations.
A disadvantage of using air-release valves is that parts of the systems using them usually operate at a lower vacuum than systems using an open vent. The lowest pressure in systems using open vents is typically not less than -1 psig or 13.7 psia. The lowest pressure in systems using air-release valves is typically 10-12 psia. The pressure can be even lower if the air-release valves are undersized. This is not a problem as long as the piping and equipment design takes into account the low operating pressure.
A second disadvantage of air-release valves is that they are typically noisy during operations. If possible, they should be where personnel are not exposed to the noise continuously. The problems of low vacuum pressure and noise are both related to the pressure drop through the air release valve. One usually can manage both problems by optimizing the balance between low- vacuum-pressure noise and the size of the air release valves used.
Case 3
Case 3 adds an air-release valve to the system at Point C. Assuming the system pressure is always greater than the vapor pressure of water, the part of the system upstream of the air-release valve operates liquid full, but the portion of the system downstream of the air-release valve operates with a mixture of air and water. This must be accounted for in the hydraulic model. Equations 2-11 model hydraulically the piping and equipment.
To determine the constants for k in Equation 2, one assumes that if the system had no elevation changes and no air present, the pressure drop in each of the segments is 5 psi. The constant C for the air-release valve was chosen arbitrarily to give reasonable airflow rates for the system.
The calculation method for the system with air present in Segment C-D is iterative, as follows:
• Select a system water flow rate.
• Assume a pressure at Point A.
• Calculate the pressure drop in Segments A-B and B-C, assuming the airflow in these segments is zero.
• Determine the pressures at B and C.
• Using the pressure at C, calculate the airflow rate with Equation 9.
• Calculate the water-air mixture flow rate and density.
• Determine the pressure drop in Segment C-D and the pressure at Point D.
The calculations have converged if the pressure at Point D equals atmospheric (14.7 psia). Otherwise, if the pressure at Point D is not close to atmospheric, one adjusts the pressure estimate at Point A until the calculation provides a suitable pressure at Point D.
The procedure is repeated for various water flow rates to generate a system performance curve.
There are more rigorous methods for treating the two-phase flow that occurs downstream of the air-release valve, and one should employ these methods when designing or evaluating an actual system. The simplified method presented previously, however, is adequate to illustrate the behavior discussed in this article.
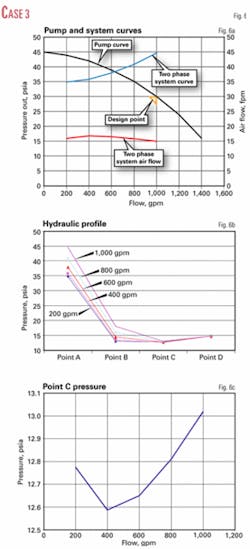
The resulting pump and system curves and the airflow rate through the air release valve are shown in Fig. 6a. The system hydraulic profiles are shown in Fig. 6b.
The results show that the system curve still is shifted to the left of the design point, but the shift is less than the shift noted for Case 2.
Fig. 6a shows that the airflow through the air-release valve increases as water flow varies from 200 to 400 gpm. As the water flow rate increases at greater than 400 gpm, the airflow decreases through the air-release valve.
The reason for this is the changing pressure at Point C. In a static system with no water flow, the pressure at Point C is atmospheric pressure. Thus there is no airflow through the air-release valve. As the water flow rises above 0 gpm, the pressure at Point C starts to fall below atmospheric and the air flow increases through the air-release valve.
As the water flow rate through the system increases further, the pressure at Point C begins to rise back toward atmospheric because of the increasing frictional pressure drop in the seawater piping downstream of the air-release valve.
Fig. 6c shows how the pressure at Point C varies as the water flow rate varies from 200 gpm to 1,000 gpm.
Case 4
Case 4 examines the hydraulic performance with an undersized air-release valve. If the air-release valve is undersized, the system can have extreme vacuum pressure created at the high points in the piping.
If the air-release valve is undersized greatly or missing completely, the pressure in parts of the system could fall to less than the vapor pressure of water and may disrupt circulation through the system.
The following example uses the same parameters as in Case 3 but includes a greatly reduced size of the air-release valve.
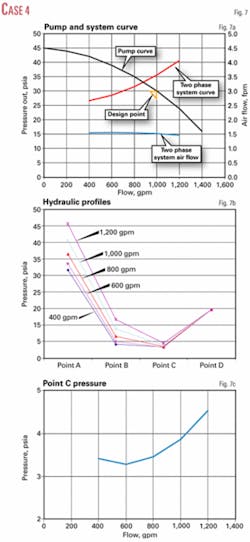
Fig. 7a shows the pump and system curves along with the airflow rate though the air-release valve. The system curve crosses the pump curve closer to the original design point of 1,000 gpm than in Case 3 because the overall reduced pressure of the system.
Fig. 7b shows the system pressure profiles and Fig. 7c shows the pressures at Point C.
Point C at the operating point where the system curve intersects the pump curve has a pressure of about 3.6 psia. This low pressure could easily collapse the shell side of a heat exchanger that was not specifically designed for this pressure.
The vapor pressure of water at 150° F. is about 3.6 psia, so that the formation of water vapor and cavitation near hot spots in the exchanger could be problems.
Open vent
The performance of a seawater system with an open vent is almost identical to the performance of a system with air-release valves. The primary difference is that the low-pressure parts of a system with an open vent usually operate closer to atmospheric than a corresponding system with air-release valves.
Conceptually as the size of the air-release valve increases, the system performance approaches that of a system with an open vent. ✦
The author
George J. Montgomery IV ([email protected]) is a process-engineering consultant for J. Ray McDermott in Houston where he has worked since 1976. He holds an MChE from Rice University, Houston, and serves as an AIChE representative on the program committee of the Offshore Technology Conference.
