Impressive Libya licensing round contained tough terms, no surprises
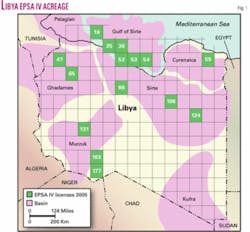
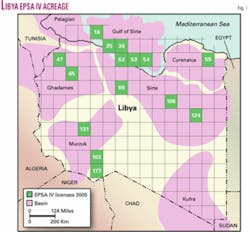
The Libyan exploration license round in January 2005 established a new historical landmark. License awards were based on a relatively new 4th generation exploration and production sharing agreement (EPSA IV). Competition was intense with an average 7 bids/block for 15 blocks in 5 basins (Fig. 1).
This impressive license round was the result of 3 key dynamics:
1. High oil prices and high price expectations;
2. Availability of new acreage that had been off the market for years; and
3. Scarcity-few opportunities like this available any more.
Analysis of this license round provides insight into the global marketplace for acreage in this new era of high prices and dwindling prospectivity.
Allocation strategy
The EPSA IV round was a sealed-bid round where the companies bid an “M factor” (production multiplier) and a “B factor” (signature bonus).
License awards were to go to companies bidding the highest M factor (or share of gross production) for the Libya National Oil Corp. (NOC). In the event of a tie on the production volume bid, the signature bonus would be the tie-breaker.
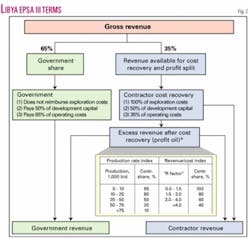
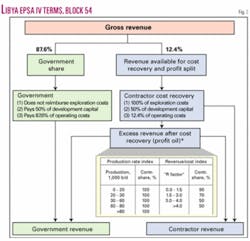
In older 3rd generation Libyan contracts (EPSA III) the production share (M factor) was set at 65%; NOC would take 65% of gross production and pay 50% of capital costs and 65% of operating costs (Fig. 2). By contrast, this production share was the main bid item in the EPSA IV round. On EPSA IV’s Block 54, for example, the high bid yielded an M factor of 87.6% which yields a maximum share of production for the contractor of 12.4% (Fig. 3).
The latest license round has drawn a lot of attention and a number of terms are being used to describe this bid item. These include “M factor” 87.6%, “Production factor” 87.6%, “X factor” 87.6%, and “Cost recovery bids” 12.4%.
The sealed bid-type auction is a common theme in the industry and works quite well with highly prospective acreage.
This approach places the burden on the oil companies of deciding what terms are appropriate. It also provides ample opportunity for transparency.
However, much of the world’s acreage is not as exciting as Libyan acreage. Most governments therefore are not in a position to simply tender their acreage through a sealed-bid round like EPSA IV and expect an adequate response.
With less exciting acreage, a government must be more creative. This is especially true if it hopes to significantly magnify the level of exploration activity in its country. It is frustrating for countries with less exciting acreage to see such intense competition as that for EPSA IV.
However, the Libya NOC could have magnified the already competitive atmosphere. It could have allocated each block individually, one-at-a-time. This was done in the exploration license round in Venezuela in 1996, where 10 blocks were tendered separately.
The bids were opened for the first block, La Ceiba, on Monday, Jan. 22, at 10 a.m. Eleven companies bid on that block, and nine of them tied on the profits tax-based bid item called the “PEG” because the Venezuelan government limited bidding on this element to 50%.
With a 9-way tie, according to the bidding rules, the companies had 2 hr to submit a tie-breaking signature bonus bid. The Mobil/Veba/Nippon consortium won with a $104 million bid. The next highest bid was $57 million.
That afternoon at 2 p.m. was the bid deadline for the second block to be awarded-the Paria West Block. So, in effect, Venezuela had 10 separate license rounds that week, with a unique bid deadline for each individual block.
In addition to the signature bonuses and the profits-based tax known as the PEG, the terms included a 16.67% royalty, additional taxes that amounted to an overall tax rate of 67.5%, and an option for the Venezuela NOC to take up a 35% working interest in the event of a discovery.
The combined effect of the 50% PEG and the other rent extraction mechanisms yielded a government take of 92%, and a landmark was established.
By structuring the Libyan bid round in the way the NOC did, there is significant risk of overbidding. When companies overbid, then threshold field size for development can become very large. Venezuela tried to avoid this type of overbidding by limiting how high the companies could bid the PEG.
Overbidding can cause problems for both the government and the companies because fields that would otherwise be economically feasible are marginalized. Overbidding with signature bonus bidding on the other hand does not have the same effect on field size thresholds.
Overbidding with production or revenue-based taxes, or the equivalent, means that there will likely be numerous delays followed by renegotiations for the relatively smaller discoveries in the wake of the EPSA IV round. Threshold field size for development (assuming a discovery is made) could easily be on the order of 500 million bbl recoverable for many of the EPSA IV licenses. The terms are that tough.
Block size
The licenses awarded in the EPSA IV round were fairly large, averaging just over 2 million acres each.
This is slightly larger than average for nonfrontier acreage these days, but it is not terribly unusual in the world (Table 1).
The Libyan blocks are nearly 5 times larger than the average block size in the 1996 Venezuelan round.
One aspect of the choice of block size is that the larger the block, the greater the risk a company will accumulate an inordinately large sunk cost position prior to discovery. When governments want to limit their exposure to exploration risk, choice of block size is an important consideration.
Work program
For the 15 licenses awarded, the total work commitment came to $298.7 million, or about $20 million/block (OGJ, Feb. 7, 2005, p. 35).
This is light by world standards these days, especially for relatively large blocks and for highly prospective acreage.
The firm work program associated with each block and the signature bonus constitute most of the initial risk capital, so it is helpful for the companies that this was not overly burdensome. However, for a 2-million-acre block a $20 million work program is relatively pathetic. Companies will likely be spending more than this.
Bonuses
Signature bonus bids that accompanied the M factor bids averaged around $8.8 million/block-only about $4/acre. The bonuses were not too impressive because they were secondary to the determining M factor.
In addition to the bonus bid (B factor), other bonuses were associated with each block. Block 54, for example, has a $1 million production start-up bonus as well as additional bonuses that will be triggered at various levels of accumulated production.
The first of these, a $5 million bonus, is triggered when 100 million bbl have been produced. Additional bonuses of $3 million each are triggered at cumulative production thresholds of 130, 160, 190, 220, 250, 280, 310, 340, and 370 million bbl.
All together, if more than 370 million bbl are produced then the total start-up and production-based bonuses will come to $27 million, and with the $6.2 million signature bonus the total comes to $33.2 million.
From the contractor’s point of view, the signature bonus is most painful. It is paid regardless of whether a discovery is made, and bonuses are not cost recoverable. Dollar-for-dollar, signature bonuses outweigh production bonuses about 10 to 1.
The contractor only hopes it will get to pay the other bonuses. These are all contingent upon making a discovery that gets developed and produces hydrocarbons.
The PSA structure
The terms are based on what is called an exploration and production sharing agreement (EPSA) that in many other parts of the world would simply be referred to as a production-sharing contract (PSC).
"In many respects the EPSA IV terms are not a dramatic departure from past Libyan contracts. Libya has never had “easy” terms.
The basic and relatively unique structure of the PSA that has evolved over the years has remained the same, although having the NOC production/participation share (the M factor) as the key bid item is new.
The differences between a typical EPSA III vintage contract and the EPSA IV terms are shown in Figs. 2 and 3. Fig. 2 is a flow diagram for an EPSA III contract (circa late 1990s). It shows typical percentages and the hierarchy of fiscal/sharing mechanics experienced in each accounting period. Similarly, Fig. 3 summarizes the key commercial terms for the EPSA IV round Block 54. The key difference is the production share/participation element.
NOC participation
The M factor and the way it works in both old and new contracts is what makes the Libyan agreements fairly unique and interesting.
It is a variation on an old theme known as “government participation.” This is one of the four main means by which governments around the world get a piece of the pie. The other three include bonuses, royalties, and profits-based mechanisms such as profit oil splits and-or taxes.
Of these four mechanisms, “government participation” is the most abstract. As shown in the flow diagrams, the Libya NOC takes a large share of production right off the top.
Regardless of its production share, the NOC typically pays for 50% of capital expenditures and its “share” of operating costs. It does not reimburse (directly) exploration costs but they are “cost recoverable.” This is not terribly unusual. Half of the governments worldwide that allow “participation” like this (also referred to as a “back-in” or “risk-free carry”) do not reimburse exploration costs. The other half do.
Countries that do not reimburse exploration costs directly typically allow the contractor to recover these costs, and that is the case in Libya. The Block 54 winning M factor bid provided 87.6% participation. Thus the NOC is entitled to lift 87.6% of gross production. While it will not participate in or reimburse exploration costs, it will pay for 50% of development costs and 87.6% of operating costs. Thus essentially, the NOC has a 50% working interest fully carried through exploration and is carried a further 37.6% through development-a two-dimensional “carry.”
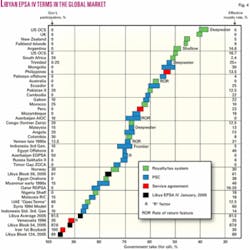
"The two-dimensional aspect alone is unusual, but the most unusual aspect is the large percentage. By world standards when it comes to government participation anything over 50% is extremely unusual. For those countries that have the participation option the average working interest is around 30% (see Fig. 4).
Government participation
Government equity or working interest participation characterized by a “carry” of some sort is relatively common.
Nearly half of the countries around the world allow some form of participation for the NOC, the oil minister, or the equivalent. Countries that use PSAs are typically more likely to use participation as one of its means of rent extraction.
This element of a fiscal system or PSA is typically governed by a “commerciality clause” that will stipulate that in the event of a discovery the contractor must appraise or delineate the discovery with at least one or two appraisal wells. If the appraisal drilling confirms the discovery is economically feasible (i.e., commercial) then the NOC (typically) or oil minister has the option of taking up a working interest at that point-it backs-in.
Back-in options like these typically range from 10% to 50% working interest. All costs incurred between the effective date of the contract to the commerciality point are defined as “past costs.”
At the point at which the NOC backs-in, only about half will reimburse the contractor for their working interest share of past costs. Even the NOCs that do reimburse their share of past costs will only do so out of up to around 60-70% of their entitlement or share of profit oil once production begins.
As far as development costs and operating costs incurred after the commerciality point or “back-in” date are concerned, the NOC will typically meet cash calls like any other working interest partner.
Analysis controversy
One of the more controversial aspects of fiscal system analysis is the treatment of the government participation or the back-in option.
Some analysts believe it is not appropriate to view this element of a system as a rent extraction mechanism.
The argument goes like this: Government take as a result of equity participation by government is really a government equity return, directly paid for by government, rather than a form of government take. Hence, comparing government take statistics by excluding government equity participation is probably a more accurate representation of levels of take.
Following this logic, the government take calculation for the Libyan licenses would ignore much of the government production share-the 50% for which it pays its way on development and operating costs. This would yield a government take of only around 50%--very good terms indeed, but misleading.
Conceptually, there is certainly a difference between say a 50% profits-based tax and a government back-in option of 50%-both of which will guarantee the government an added 50% share of profits. An oil company would happily avoid both.
From a purely financial point of view, companies will certainly prefer 50% government participation to a 50% tax because, with participation, after the NOC backs in, it “pays its way.”
Just how different the financial impact is between a 50% tax and a 50% back-in depends on profitability. As profitability increases the back-in or participation element takes on more of the characteristics of a pure tax or a royalty depending on the point at which the government takes its share of production.
"While it is conceptually a bit abstract, as costs relative to gross revenues approach zero (the ultimate in profitability) the back-in begins to take on all of the characteristics of a tax, or in the case of EPSA IV, a royalty. Thus, the less profitable a venture is, the less painful the government participation element is. Either way, though, both taxes and-or participation options cause the contractor financial pain to various degrees.
Comparing two fiscal systems on the basis of government take alone then is not a perfect comparison if one system has participation and the other does not. This highlights one of the key weaknesses of government take statistics. However, to simply ignore the participation element would also be a misrepresentation.
When comparing fiscal terms for exploration rights, it is not appropriate to exclude or ignore the participation element as the argument above suggests.
Profit oil split
Once the contractor recovers costs, excess oil (profit oil) is divided between the NOC and the contractor.
Historically, in Libya the profit oil split has been slightly complicated because it was governed by a two-dimensional sliding scale based in part on production levels as well as an “R factor” (Fig. 2). The R factor is basically a simple payout formula.
In each accounting period the payout status of the contractor is calculated by dividing the contractor’s accumulated receipts by its accumulated expenditures (both capital costs and operating costs). This yields a ratio, hence the term “R” (for “ratio”). Once a predetermined threshold has been reached, then in the next accounting period, the new profit oil split applies.
An example profit oil split calculation for the EPSA III terms is as follows (Fig. 2):
1. Assume that production during the accounting period averages 40,000 b/d of oil.
2. Assume further that the payout status in this accounting period is 1.7 (i.e., the contractor has recovered 100% of its accumulated expenditures plus an added 70% above and beyond that).
The first step is to calculate the production-based split. This calculation is based on gross production, which will determine how profit oil is shared. The calculation for the contractor share is a weighted average as follows:
- 10,000/40,000 bo/d * 0.95
+ 15,000/40,000 bo/d * 0.80 +
15,000/40,000 bo/d * 0.50 = 0.2375
+ 0.30 + 0.1875 = 0.725 (or 72.5%)
The production-based split alone therefore yields a contractor profit oil share of 72.5%, but this is further reduced because the “R factor” is above the first threshold of 1.5, so the contractor only receives 80% of 72.5% of the profit oil, or 58%.
Government share of profit oil in this accounting period then is 42%. Notice that the production-based aspect of the profit oil split has been neutralized in Block 54 (Fig. 3). Only the R factor sliding scale element applies.
Taxes
The contractor does not pay taxes directly in the Libyan agreements.
Taxes are paid for and on behalf of the contractor out of the NOC share of production-taxes in lieu. The tax rates are: 65% income tax and 4% jihad tax.
The rates of these taxes are relatively unimportant from a financial point of view because the NOC pays these taxes on behalf of the oil company. However, when it comes to booking barrels (discussed below) the tax rate is important.
These systems with taxes in lieu are considered to be some of the most stable contracts in the world. This is because changes in tax rates will not likely impact the contractor-they impact the NOC.
Government take
With all the means by which the government gets a piece of the pie, the overall government take is around 88% on average for the EPSA IV blocks (Table 2 and Fig. 4).
Government take is the government share of total (full-cycle) project cash flow defined as gross revenues less costs (capital and operating).
Average EPSA IV government take is slightly higher than the famous Indonesian standard contract for oil (with over 85% take), but in those contracts the government does not fund a portion of development or operating costs.
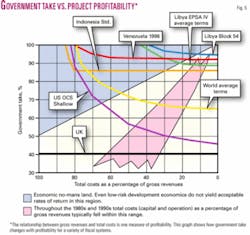
Government take for all of the Libyan EPSA IV licenses can easily exceed 100% under a variety of scenarios: low prices, high costs, small discoveries, or various combinations. This is true of other systems as well (Fig. 5). However, companies are not exploring for marginal or submarginal fields.
The kind/size of prospects that will justify risky exploration efforts and expenditures will yield a government take of less than 100% but not by much with EPSA IV terms.
The terms for the hotly contested Block 124 are among the toughest in the world (from the company point of view). The terms for this particular block would be roughly the equivalent of the famous old standard Indonesian contract for oil (with a government take of over 85%) with an extra 60% layer of tax imposed.
Effective royalty rate
Beyond the division of profits (take), another key measure of the robustness and efficiency of a fiscal system is the effective royalty rate (also sometimes referred to as “minimum government take”).
The effective royalty rate is the minimum share of revenues or production the government would expect in any given accounting period. Often when this statistic is quoted the government participation element is ignored. Thus only the effects of royalties and cost recovery limits are included.
However, most analysts view the EPSA IV government share as having many of the characteristics of a royalty: It is taken right off the top and deprives the company of access to these revenues (or production) for cost recovery purposes.
This is the main reason why many analysts refer to the EPSA IV M factor as a “cost recovery bid.” They would view the 87.6% M factor for Block 54 as a 12.4% cost recovery limit. And 12.4% of revenues is all that is available to the contractor for cost recovery purposes.
Typically around the world the contractor has access to considerably more than this, like 70-90%. So essentially the EPSA IV government take is not only relatively high but it is also significantly front-end loaded.
Contractor entitlement-booking barrels
With most PSAs the contractor lifting entitlement consists of two components, cost oil and profit oil, and this is also the case with the EPSA IV contracts.
During the 1980s and 1990s with typical PSAs and oil prices of that era, the lifting entitlement for PSAs fell in a range of 50-60%. And typically, companies would “book” barrels according to their lifting entitlement. There are, however, two key exceptions to this general rule.
Companies are booking barrels under service agreements (like Venezuela) where, by definition, companies do not take title to hydrocarbons. This is true of the Iranian buybacks, too. Companies also typically book something other than their “entitlement” barrels with systems where the taxes are “in lieu” like Libya, Egypt, Oman, Trinidad, Syria, and the Philippines.
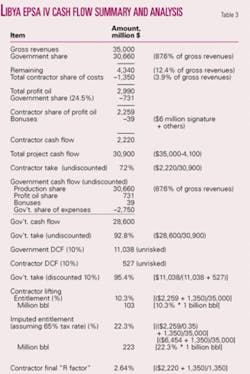
The justifying logic is that, had taxes been paid directly (in cash), then the contractor lifting entitlement would have been greater. To calculate what that entitlement would have been, the companies divide their actual profit oil entitlement by a factor equal to one minus the tax rate. This “grosses up” their entitlement and typically the companies will “book” this grossed-up percentage of their working interest share of proved reserves. The example economic results show the contractor lifting entitlement, is 10.3% of production but the “imputed” entitlement is twice that, 22.3% (Table 3).
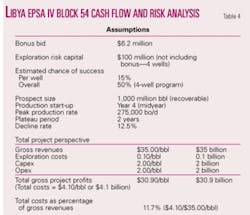
Block 54 cash flow and risk analysis
In order to illustrate the nature of the EPSA IV terms, cash flow analysis was performed for an assumed 1 billion bbl discovery.
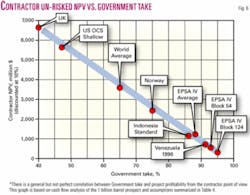
Other assumptions including a $35/bbl oil price are summarized in Table 4 and Fig. 6. These two assumptions in particular (field size and oil price) are relatively robust.
However, unless conditions are robust the analysis of the division of profits for Block 54 would be a moot exercise because all profits would go to the Libyan government (i.e., government take exceeding 100%). In fact, for most of the winning bids in the EPSA IV round anything less than $35/bbl is probably not going to work.
It is further assumed for the cash flow analysis that total costs to develop the 1 billion bbl field will come to $4.1 billion-$100 million exploration capital plus $2/bbl capital costs and $2/bbl operating costs. Of these costs the NOC pays $2.75 billion and the contractor pays $1.35 billion.
Expected value analysis on Libya Block 54
A simple two-outcome expected value (EV) analysis is used to compare bids received for Block 54. This kind of analysis is more meaningful for complex bids that include both bonus bidding as well as production or profits-based bid elements.
Beyond that, it is assumed that in addition to the $6.2 million bonus $100 million in exploration capital is exposed. Assuming a 50% chance of discovering 1 billion bbl, the Libyan government’s expected value for the highest bid comes to $5,520 million. The basic equations are as follows:
Government EV = $6 million * 50%
+ $11,038 million * 50%
$5,520 million
There is a 50% chance that the government will only receive the $6 million bonus but another 50% chance that it will receive both the bonus as well as cash flow from its participation in a discovery and profit oil share which comes to $11,038 million.
Contractor EV = -$106 million *
50% + $527 million
* 50%
= -$53 million +
$264 million
= $211 million
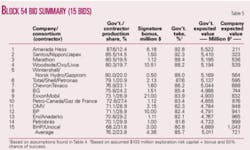
The difference between the high bid for Block 54 and the next highest bid in terms of EV is $115 million ($5,525 minus $5,410 million). From this perspective the two bids are only around 1.6% apart.
A new era
The Libyan round is one of the first really significant offerings in this new oil price era.
The universe of fiscal terms that exists today for the most part was forged in an era of much lower oil prices. So it is not really surprising that the EPSA IV terms fall in the region of the famous old Indonesian terms and the 1996 Venezuelan terms.
With the relatively small bonuses and modest work programs, the risk-side of the risk/reward equation was not too oppressive for contractors. The real action in this license round involved the reward-side of the equation. The really heavy aspects of the EPSA IV fiscal terms will be felt only if a discovery is made.
The terms carved out by industry in the EPSA IV license round are tough and relatively unforgiving. Some fairly large discoveries will not be large enough to develop economically under these terms. Yet, if oil prices remain much above $35/bbl then some of the winning bidders are going to look like geniuses. Oil price is critical in this round.
Experience has shown that companies get aggressive in situations like this. Just as the winning bids are surprising to many, many bids were unexpectedly low. More than half of the bids submitted for Block 54 represented terms that were more lenient than the famous old Indonesian standard contract with over 85% government take (Table 5). And during the 1980s and 1990s, an era with significantly lower oil prices, Indonesia signed many of these contracts. It’s a new day and age.
The author
Daniel Johnston (daniel @danieljohnston.com) is a financial consultant with 24 years in the international petroleum industry. He lectures worldwide on petroleum economics, finance, and risk analysis and has written eight books on these subjects. He founded his consulting practice in 1985. He has a BS degree in geology from Northern Arizona University and an MBA in finance from the University of Texas at Austin.
