Program tracks wet gas feedstocks through two-phase offshore trunkline
A computer program called the "Trunkline Monitoring System" has been developed to track the evolution of a mixture of wet gas feedstock compositions and associated condensate by-products that travel through a two-phase offshore trunkline to onshore gas processing facilities.
The program helps operators of gas processing facilities control the quality of sales gas and keep it within contractual limits. That is typically performed by adjusting the flow rates of one or more producer platforms in a timely fashion to compensate for unexpected and-or unavoidable flow fluctuations in other producing platforms.
null
The tool provides operators with the necessary information to decide the best operational action and the optimum timing for its implementation.
The tool is a "soft" sensor to complement facility measurements with information that in practice cannot be obtained by direct measurement, e.g., trunkline condensates inventory, gas composition, and Wobbe index at different trunkline locations. It also is a predictive platform to investigate what-if or look-ahead scenarios, e.g., to analyze the influence of future flow changes on gas quality and liquid production.
The system uses a combination of AspenTech, Shell, and third-party technology. The simulation platform consists of AspenTech's Hysys Dynamics as flowsheeting program, HYFLOW as transient multiphase trunkline model, and HYSPPTS as thermodynamic engine. PI from OSI Software Inc. is used as the source of the online data (data historian), and ProcessBook, also from OSI Software, is the framework hosting the system graphical initerfaces.
Field use
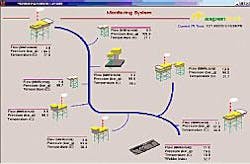
The 235-mile NOGAT trunkline is located in the Dutch part of the North Sea, and it connects eight offshore platforms to onshore gas processing facilities near Den Helder, the Netherlands (Fig. 1). The pipeline operates inside the two-phase region; each platform delivers both gas and condensate to the line.
Two of the platforms sit on oil fields, and the offgas from the oil stabilization units is compressed and delivered to the pipeline. The current total capacity of the gas transportation system is about 22 million cu m/day, associated with 750 cu m of condensate/day.
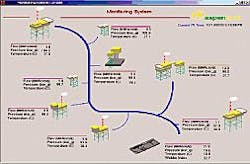
The onshore facilities include a 1,000 cu m slugcatcher, condensate stabilization units that remove volatile components from the trunkline produced liquids, and a series of low-temperature separation (LTS) units to dry the sales gas prior to delivery to the distribution network (Fig. 2).
There are two major challenges to operating the system:
- Controlling the sales gas quality in terms of its Wobbe index. The different platforms produce different gas qualities (compositions) and quantities (i.e., flow rates) that are fed into the line at different locations. Therefore, the quality of the gas that travels through the trunkline varies along its length.
Since flow rate fluctuations that cause compositional changes of the mixture transmit downstream at a finite velocity, the quality of the gas at a given location also varies along time. In spite of this, the sales gas quality must stay within the contractual limits at all times (i.e., Wobbe index values between 49 and 54).
- Controlling the condensate inventory of the trunkline. The amount of condensate retained inside the line builds up during periods of low gas demand, particularly in trunkline depressions. The available slug catchers and condensate stabilization unit capacities limit the production ramp-up speed and force the scheduling of periodical clean-up cycles to keep the trunkline liquids hold-up below certain critical limits.
Neither the Wobbe index nor the condensate hold-up profiles along the length of the trunkline are directly measurable through field instrumentation. The computer calculation program described in this article provides such information, and allows facility operators to control the gas quality and the condensate hold-up to ensure uninterrupted delivery of on-spec gas.
Architecture, simulation models
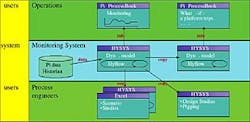
The system is constructed around an executive application which uses Hysys Dynamic models as the main simulation engine (Fig. 3). The executive application handles the necessary data transfer between historical databases and simulation models. Two Hysys Dynamic models are integrated in the application. These are the so-called "online model" to monitor the present time conditions in the trunkline, and the "predictive model" to perform what-if analyses and determine the consequences of programmed or unexpected variations in operating conditions (typically gas supply flow rates).
The executive application gathers platform flows and temperature values, as well as delivery pressure from the PI data historians, and uses them as model specifications for the dynamic time-step calculation. Platform discharge pressures and gas delivery flow are computed by the simulation models and stored by executive application back into the PI data historian. Space discrete information, such as pressure, temperature, flow rates, velocities, and holdup profiles are archived in a dedicated database.
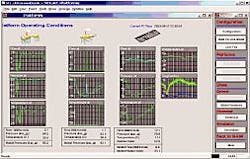
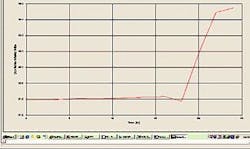
PI ProcessBook user interface for the system shows actual conditions vs. model calculated data (Fig. 4).
Predictive what-if or look-ahead studies are triggered from the system graphical interfaces. The predictive model retains the process and trunkline internal conditions to serve as an initial state for simulations. The user is given the option to edit individual platform flows and onshore landing pressure or flow. The time horizon of the prediction is also an input value.
Simulation results provided by the online and predictive parts of the tool are available to the operators by means of graphical user interfaces (GUIs) that were constructed using OSI PI ProcessBook. Fig. 4 shows an online comparison of actual process conditions vs. model calculated data.
null
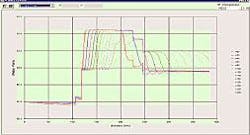
Predictive results are shown as a series of tables and charts that track the evolution of line conditions (i.e., Wobbe index, compositions, condensate holdup, velocities, flows, and pressure) along the trunkline distance and vs. time (Figs. 5 and 6).
Operation of the 380-km long trunkline is seldom in steady state due to the long traveling times, relatively large time constants, and inevitable changes in flows. Unlike other less-capacitive systems, operation of these trunklines must take into account fluid dynamics.
Steady state simulation is a well established and powerful tool for design and engineering studies but its value for online monitoring and operations assistance diminishes when compared with dynamic simulation.
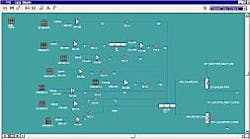
The Trunkline Monitoring System used on NOGAT is entirely based on dynamic simulation packages. Fig. 7 shows a schematic representation of the model, as it is constructed in the Hysys simulation environment.
Gas and condensate sources are modeled by means of standard Hysys process streams. While gas flow rates are automatically retrieved from PI data historians, condensate flow rates are calculated through dedicated Hysys spreadsheets using average CGR values for each platform. Gas and condensate compositions are set as fixed parameters in the corresponding Hysys process streams.
Two Hyflow objects represent the trunkline and the 20-km branch that connects the X2 platform with the trunkline. The other branches are of much smaller length and do not contribute significantly to the overall system dynamics (Table 1).
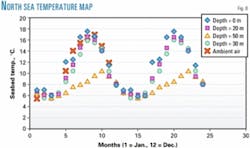
Due to the characteristics of the trunkline, the inside temperature profile was assumed to be equal to the ambient temperature profile (simulation runs revealed the adequacy of such assumption). Ambient temperature profiles, from linear interpolation on the North Sea temperature map shown in Fig. 8, take into account depth below sea level of each one of the trunkline segments, as well as the date. Ambient temperature profiles are regularly updated in the simulation models.
The physical properties of the gas condensate mixtures are calculated by means of the HYSPPTS package, and using the Shell SMIRK proprietary correlations and PEPPER databases. Although the available chromatographic analysis provided information for up to 49 chemical species, the components slate was simplified by lumping the C6 and heavier components into a smaller slate to achieve the desired model calculation speed.
This grouping of heavy components did not affect significantly the physical properties of the system and resulted in a two-fold computational speed increase.
null
A maximum error of 0.5% in Wobbe index with respect to the full chromatographic analysis was calculated, and mean relative errors of 0.12 and 2.2% were encountered in the comparison of pressure profiles and condensate holdup profiles.
Model results
Even on today's powerful desktop computers, calculation speed is still a limiting factor for dynamic two-phase flow combined with rigorous physical property calculations. Special care must be taken to configure the model so that simulation runs are performed significantly faster than real time.
Because the online model must always be synchronized with events happening in reality, it is a requisite that the model calculate 10 min of realtime simulation (data histotian sampling frequency) in a computational time which is only a fraction of that time period. Other tasks, such as storage of calculated results and simulation back-ups, must also be performed within the available 10-min timeframe.
Another important factor is the ability of the models to provide fast responses during predictive or look-ahead studies. Although these simulations depend on the numerical difficulty of the what-if case and-or the number of disturbances introduced by the user, on average the model comes up with answers in 5 min realtime, and provides predictions for a future time span of about 24 hr. That means the simulation results can be effectively utilized for defining any operating and corrective actions in a timely fashion.
There are three major factors that in general influence the speed of calculation:
- The division of the trunkline in a finite number of cells.
- The selected time step size for the simulation.
- The number of components used in the thermodynatruic calculations (as previously described).
It is therefore necessary to choose a balanced solution between accuracy and speed of calculation by optimizing the number of trunkline cells, time step size, and number of chemical components.
Dedicated simulation runs were performed to select the most suitable values for these parameters. The online trunkline model was given a mathematical grid of 84 cells, and it was able to run as fast as 40 times realtime in a Pentium IV mathematical processor. The predictive model is a copy of the online model, which uses a grid containing fewer cells than the online model (32) and performs its calculations 250 times faster then realtime.
While the predictive model to some extent sacrifices accuracy, predictions are found always to be influenced more by the estimates and forecasts of future platform flows provided by the user as simulation inputs than by model inaccuracies.
Accuracy
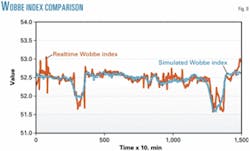
As mentioned, the model uses platform flows and trunkline landing pressures as inputs. It calculates the platform discharge pressures and flow rates delivered to onshore processing facilities and the gas and condensate compositions traveling towards shore. Fig. 9 compares the results in terms of delivered gas quality.
A slight difference is expected when the Wobbe index of the trunkline delivered gas composition is compared with the actual sales gas measurement because the gas processing facilities remove the heavy components from the gas which reduces its gross heating value.
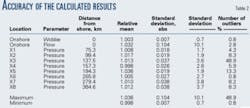
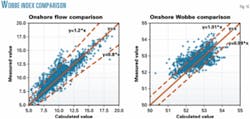
Table 2 and Fig. 10 analyze measurements taken between Apr. 25, 2003, and Sept. 9, 2003. The table shows the distance from the onshore location, the mean relative errors, the absolute and relative standard deviation (assuming normal distribution), and the number of discarded measurements. The percentage of measurements discarded due to failures in data transmission to the historians is included in the last column as number of outliers.
The statistical comparison in terms of condensate flows is more problematic, since no direct measurement of the slug catcher's liquid inlet flow is available, and therefore this has to be induced from mass balance calculations based on reported slug catchers discharge flows and level controller readings. That unfortunately does not provide stable and reliable data for the necessary calculations.
The error in slug catchers inlet flow, derived from measurement data, is at least 30%, and literature on dynamic simulation packages of the type of Hyflow/Traflow reports show average errors of 20% for calculated liquid hold-ups. Therefore, comparing "measured" and calculated data is not viable in our case. This aspect of the system is currently under investigation.
Future
Further developments of the system are planned in the following two areas:
- NAM has planned new field activities aimed at connecting a new 100-km branch to the trunkline through the F3 platform. This modification of the network requires an upgrade of the existing models. The Hysys model already has been used to calculate the ullage and to investigate the impact of this modification on the flow regimes and the performance of the onshore facilities. Performance results and new developments will incorporated into the Trunkline Monitoring System models.
The existing models only consider the behavior of the transport trunklines. Nevertheless, once the gas and condensate streams reach the onshore facilities, the gas facility operators modifying the quantity and quality of these two streams to increase gas production and to adjust the quality to contractual specifications.
The extent of such transformations is limited by the equipment capacity. The Trunkline Monitoring System will be upgraded and extended to account for these transformations. For instance, the sales gas Wobbe index (which differs from Wobbe index of the raw gas delivered by the trunkline) will be estimated with the help of simplified Hysys steady state models.
These models will be developed not only for the actual gas stream entering the gas facilities, but also for the various locations along the trunkline. Similarly, these simplified models will also provide estimates of the amount of offgas produced at different trunkline locations. These developments will increase the functionality of the program and will allow operators to more-easily anticipate potential problems occurring onshore, such as excessive offgas flow rates which may go beyond the compressor limits.
System success
Connecting the process engineering models to online measurement data stored in historians has been successful for the support of opperational decisions.
The described computer program has been installed in the control room of the onshore processing facilities since March 2003, and the operators successfully utilize the system for predicting and managing the gas quality.
The implemented system architecture has proved to be very valuable, in particular the concept of building a realtime system around a standard flow sheet simulation program like Hysys.
The calibrated models developed for the online system are now also used by process engineers for offline analysis. For instance, the clean-out cycles for managing the large amount of condensate which develops inside the trunkline during summer low-demand periods were defined with the help of the computer program. Potential slugcatcher overflow was prevented by a correct adjustment of platform flows.
The operators can easily carry out the day-to-day runs, while the process engineer, more familiar with the Hysys simulation environment, can develop the more-sophisticated engineering analyses with the confidence that they are based on models that match reality.
The model centric approach of the system and the clear split between application components and simulation model also facilitates model maintenance and upgrades.
The speed of calculation is more than sufficient to keep the online model synchronized with realtime events. Similarly, the predictive case's time response is satisfactory for the end-users.
The accuracy of the calculated results for gas quality is more than sufficient to support the necessary operational decisions. Although the accuracy of the results regarding liquid inventories is not clear at present, the availability of these data is already a major improvement with respect to the previous situation when information on this aspect of the process was completely missing.
Acknowledgments
The authors thank Johan Romate and Geert Karman, Shell Global Solutions International BV, Amsterdam, for their valuable advice on the work presented here. We also recognize all the operators and personnel of the onshore processing facilities, and in particular Frans Derks. We also thank Nestor Piazuelo, Jaume Soria, and Judith Forcadell (AspenTech Barcelona) for the valuable work done in the development of the tool.
The authors
René la Rivière (rene.lariviere @shell.com) has been a senior process engineer for NAM BV in Assen, the Netherlands, since 2001. He holds a degree in chemical engineering from the University of Groningen, the Netherlands, and previously worked on a PhD study for the university on an automated capacity monitoring system for gas facilities.
Juan Carlos Rodriguez (juancarlos.rodriguez@ aspentech.com) has been a senior process engineer in the Aspen Technology Ltd. organization since 1999, where he has worked in the area of oil and gas process simulation and optimization. He holds a PhD in chemical engineering from the University of Zaragoza, Spain.
