Implementing ERM-2: The link with risk management
A systematic, integrated approach to risk identification and assessment from a portfolio perspective enables companies to implement transparent enterprise risk management (ERM) systems tailored to the oil and gas industry. Such an approach has been described by Wood.1 2 As described in the first part of this two-part series, ERM has become crucial to compliance with corporate-governance requirements of the Sarbanes-Oxley Act (OGJ, Mar. 21, 2005, p. 18).
Diversification alone is not a sufficient risk-management strategy for exploration and production asset portfolios. It is essential to perform risk analysis at the asset and portfolio levels. The analysis should be holistic, taking into account the many facets of risk and building options into the valuation models to exploit identified opportunities.
In its simplest form, this integrated and holistic E&P risk analysis scheme assesses 12 distinct components of each asset on a probabilistic basis with equal weight and assumes that each component is independent. The assumption of independence is therefore a simplification of a more complex overall interaction of the different facets of risk affecting E&P projects. However, it does provide a method for rigorous and systematic assessment.
Six of the components relate to the subsurface risk factors: reservoir presence, migration route, trap, seal, source rock presence, and maturity. The other six components relate to operational risk factors: location, technology, timing, fiscal, political, and business. For other sectors of the oil and gas industry-such as LNG, power generation, refining, and retailing-the former six factors are replaced in this system by relevant technical factors. For example, in refining these factors are crude supply, refinery configuration, product specifications, distribution network, wholesale markets, and turnarounds. The system assesses and scores the 12 attributes, illustrated by matrix cubes, reducing each factor’s score to a probability measure called “integrated success factor.”
The probabilities are multiplied (assuming independence) to provide an overall chance of success, which are then used to adjust discounted cash flows (DCF) to express them as risked net present values (NPVs) in expected monetary value (EMV) terms. This adjustment is best made to net present value distributions generated from Monte Carlo simulations that enable a range of scenarios to be evaluated, capturing upside (opportunity) and downside (outcomes) from key variables input as distributions. Simulations facilitate stress-testing and sensitivity analysis of input-variable distributions and risk factors. As many oil and gas projects involve embedded options, which are difficult to value by conventional DCF, the integrated success factor can also be applied to risk-adjust a real-options project valuation.3
The word “integrated” is important to this holistic approach, which focuses on all the risks associated with specific projects, many of which are indeed unique to individual projects. This distinguishes it from the partial assessments that seem to prevail in the industry. In these assessments, companies focus on either “technical” or “country” risk assessments, conducted by different corporate divisions or by external advisors, to risk-adjust cash flows or discount rates.4 They thus make no attempt to provide an overall assessment that transparently integrates and displays all facets of project risk.
Complications
While no probabilistic scheme is perfect or able to provide exactly the “right” numerical answer, an integrated probabilistic approach offers at least to provide insight to the many facets of risk to which E&P projects are exposed by applying a transparent and simply displayed system.
A drawback to probabilistic risk assessment schemes in general is the subjective way in which probabilities are often assigned to the component attributes. This creates the opportunity for the unscrupulous to manipulate results. The use of a transparent multiattribute system, with information coming from several departments and individuals and applied in a rigorous and systematic way for each project, provides the best safeguard against subjective manipulation. Reviews by “expert panels” incorporating multidiscipline, in-house and external experts can significantly reduce subjectivity.
In a simple system, correlations between different facets (categories) of risk are ignored, each one being deemed to be independent. For some risk categories, dependencies are more complex, and correlations certainly exist but can be difficult to quantify. Correlations may require more detailed evaluation and a modified mathematical approach to combining them to calculate an integrated success factor.
Some decision-makers rely almost exclusively on qualitative, unstructured information, while others rely almost exclusively on quantitative, structured information. Efforts should be made to appreciate, integrate, and document both types of information in a systematic risk-assessment process and, where possible, to convert unstructured into structured information. If this does not occur, it is possible for a business unit to conduct a thorough, systematic, and quantified risk assessment that managers disregard, relying on experience or “gut feel.” Management override5 such as this is clearly not an effectively managed ERM system, although it may be reported in such a way as to satisfy compliance requirements.
Project perspective
From our perspective, projects and assets must partially drive an effective ERM system (see Fig. 1, OGJ, Mar. 21, 2005, p. 19). The intent here is not to provide a comprehensive review of all requirements of project risk and opportunity management but rather to provide a sampling of the approaches, details, and complexities required for its implementation at the project level.
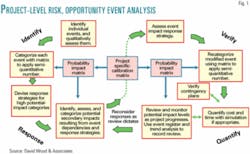
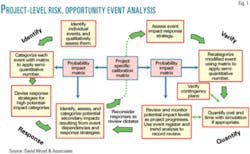
Risks and opportunities at the project level are first identified and assessed qualitatively, perhaps with the use of a matrix in order to be systematic (Fig. 1). Detailed assessment and event-response strategies require at least a semiquantitative approach in which impact-vs.-probability criteria discriminate risks and opportunities with potentially substantial outcomes. All identified events are documented in an event register with details of initial qualitative and semiquantitative assessments.
Key steps in a structured, systematic, and consistent risk-assessment process, illustrated in Fig. 1, are:
• Step 1: event identification draws on experience of past projects (learning curve).
• Step 2: probability vs. impact highlights key risks and opportunities and categorizes them using a consistent scoring system.
• Step 3: response strategies seeks and evaluates options, contingencies, and strategies to address and mitigate or exploit high-impact categories.
• Step 4: assessment of secondary impacts and event interactions. These can arise during implementation of contingency plans. Two tolerable events can in combination lead to an intolerable risk so it is important to assess the impact of risks interacting.
• Step 5: assessment of the impact of response strategy reassesses identified events, taking into account remedial and planned mitigation or exploitation options, and determines residual impacts of each event using the matrix.
• Step 6: verification of fallback and contingency plans confirms the actions to be taken and the responsibilities and consequences that will arise if, despite the mitigation or exploitation option adopted, the event materializes (or fails to materialize in the case of an opportunity).
• Step 7: quantitative impact analysis conducts detailed economic impact evaluation, cost, sensitivity, and scenario analysis for key events. In large, complex, or high-cost projects, this should involve simulation with the uncertainties defined as input distributions to forecast the range of cost-time outcome possibilities. A quantitative approach should help to evaluate options and aid decision-making. Analytical results and assumptions should be recorded in the project event register as part of the ongoing review.
• Step 8: postmortem evaluation of event register conducts learning process.
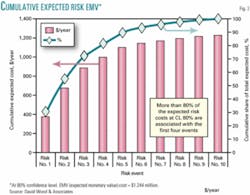
At the project-level, quantitative event analysis builds upon the likelihood-consequence approach of the semiqualitative methods to provide absolute values associated with specific outcomes. EMVs of quantitative risk and opportunity analysis involve combining the likelihood and consequence data and expressing it as a probability distribution. Such information for each identified event can be ranked and displayed individually and cumulatively in order to identify the key risks at certain levels of confidence and the contribution of groups of risks to the overall risk exposure (Fig. 2).6 This type of analysis is useful in identifying key events that require urgent mitigation or exploitation.
Fig. 2 shows an example plot considering project risks only. It is apparent that 90% of the project EMV risk costs are associated with the first five, ranked risk events. Such graphical representations help risk managers focus their efforts on devising mitigation strategies for the key risks.
For a large project, the event assessment-response process usually progresses through several review stages with the deemed acceptability of each event recorded in the event register. Three acceptability categories for opportunities are exploitable, insignificant, and unexploitable. Three acceptability categories for risks are intolerable, significant, and tolerable. For risk events it is useful to monitor and record the total number of events identified in each category of acceptability. These can be displayed graphically (Fig. 3) as the project progresses through its review stages to monitor how their impacts have been reduced.
Such displays are useful to decision-makers involved in sanctioning a project, allowing them to review how risks have been progressively addressed and mitigated in project design and determine whether remaining risks are tolerable. A project is typically sanctioned when intolerable risks have been removed or robust contingency plans or mitigation strategies have been developed to deal with them. Recording this progress is a key part of a transparent ERM system as it can be used to monitor project progress and help to improve future projects.
Response strategies-mitigation or exploitation-that can be recommended for each type of risk or opportunity event take many forms. They can make use of contract terms, payment structures, insurance, guarantees, and export credits and include actions such as employing specific skill sets or experience, involving local partners, and hedging. Other examples include adopting high-specification materials and implementing specific quality-control, safety, or environmental-protection measures. Such measures can significantly reduce risk exposure and unlock opportunities to improve performance.
In some cases, the response strategies cause secondary events that may themselves require mitigation or exploitation. Further review of these secondary and perhaps tertiary events is then necessary. This process takes time to achieve acceptable profiles of risk exposure and to ensure key opportunities have been evaluated for potential exploitation. It requires both technical and commercial skills and if well performed and documented can make the difference between project success and failure.
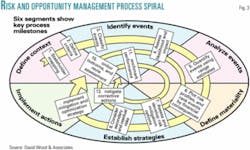
Conducting risk and opportunity management at the project level can be described in terms of a sequence of 12 key steps associated with identifiable milestones. Each step is dependent upon and builds on results of the previous step. The 12 steps and six milestones are not necessarily linear in nature; more often, they are repeated in a spiral (Fig. 3). The six milestones are:
1. Define the context for risk and opportunity management.
2. Identify individual risk and opportunity events.
3. Assess the likelihood and impact of those occurrences (analysis).
4. Establish significance thresholds (evaluation).
5. Devise risk-mitigation and opportunity-exploitation strategies.
6. Implement strategy (sanction project), and monitor performance.
Expert panels
An expert panel, the make-up of which may vary from project to project, can achieve quality control of input into the risk and opportunity-management process and play a key monitoring role. The effectiveness of expert panels depends on the skills and background diversity of its members (such as technical, operations, financial, public relations, legal, safety, environment, and community) plus the depth of their industry-sector, operational, and local knowledge. A well-structured and focused expert panel is least likely to omit major events (posing risks and opportunities) from Step 3 of the process. A level of independence from the project sponsor is essential, but a panel consisting of a mixture of in-house and external consultants can work well as an integrated team.
A credible and well-respected team of experts is most likely to convince stakeholders (both for and against a project) and members of the project team of the likelihood and potential impacts of key events and to satisfy compliance and transparency requirements. In the absence of actuarial data, the panel is best equipped to quantify event likelihood and impact distributions and to establish appropriate levels of insurance.
Reputation of experts is important. Decision-makers find it hard to ignore panels combining experts from diverse backgrounds with national or international reputations that present their case in a well-documented fashion based upon quantified structured analysis. ✦
References
1. Wood, D., “E&P asset/portfolio risk analysis: Addressing a many-faceted problem,” OGJ, Sept. 29, 2003, p. 49.
2. Wood, D., “More aspects of E&P asset and portfolio analysis,” OGJ, Oct. 6, 2003, p. 28.
3. Bravo, O., Wood, D., “Options approach aids development decision for Colombian field,” OGJ, July 19, 2004, p. 38.
4. Aven, E., Floerenaes, S., “Country Risk: Quantitative Measurement and Analysis,” Global Association of Risk Professionals, May/June 2004.
5. Committee of Sponsoring Organizations of the Treadway Commission (COSO), draft Enterprise Risk Management Framework, July 2003, p. 90.
6. Bowden, A.R., Lane, M.R., Martin, J.H., case studies described in Triple Bottom Line Risk Management: Enhancing Profit, Environmental Performance & Community Benefit,Several of he items are going to be found John Wiley & Sons, 2001.


