Cost functions estimate offshore liabilities
DECOMMISSION OBLIGATIONS— Conclusion
Cost functions provide an estimate of offshore decommissioning liability from which one can establish a fair market value for platform decommissioning in the Gulf of Mexico.
This concluding article in a two-part series discusses cost functions for the three primary stages of decommissioning: plugging and abandoning the wells, structure removal, and site clearance and verification.
Although it is not possible to identify all of the characteristics that affect decommissioning, a finite set of descriptors usually is sufficient to quantify each stage of the process.
Part 1 of this series (OGJ, Mar. 14, 2005, p. 43) described the factors affecting the time and cost to perform these operations and the accounting changes that will result from the proposed implementation of US Financial Accounting Standards Board (FASB) Statement No. 143, which covers long-lived assets.
P&A wells
The US government requires lease operators to plug and abandon (P&A) wells in its outer continental shelf (OCS) within 1 year after a lease terminates.
The industry bases P&A techniques on experience and regulatory standards and requirements. All wells must be P&A'd prior to cutting and removal of the conductors. Most P&A work normally takes place well in advance of removal operations.
The analysis in this article uses data for P&A costs compiled from job reports in the Gulf of Mexico conducted by Tetra Applied Technologies LP during 2002-03.1 The sample set includes 118 jobs and 390 wells.
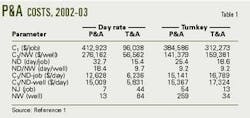
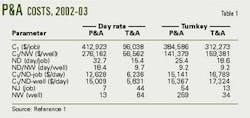
The primary factor determining P&A cost is the degree of difficulty encountered with the well that is experienced as unforeseen time or operational delays. Table 1 depicts the average total cost (C1) and number of days (ND) required to perform P&A operations according to contract type and job specification. NJ and NW denote the number of jobs and number of wells in each category.
The analysis specifies jobs as either plug and abandon (P&A) or temporarily plug and abandon (T&A). In T&A operations, an operator expects to re-enter the well later, and therefore plugging requirements are not as rigorous, casing string are neither cut nor pulled, etc.
All things being equal, the average T&A job will cost less than a P&A job. In the sample set, most T&A contracts had day rates, while most P&A contracts were on a turnkey basis.
The empirical data for day-rate contracts supports the conclusion that the normalized cost for P&A operations should exceed the cost for the T&A of a wellbore. But the results are mixed for turnkey contracts, which should be priced at a premium relative to a day-rate contract.
For a T&A contract, the normalized total cost for a turnkey operation exceeds the day-rate operation by about $100,000/well, while for P&A operations, the total cost for a day-rate contract exceeds the turnkey contract by about $140,000/well.
A linear functional, Equation 1 (in the accompanying equation box) models the total cost of a P&A operations.
In the functional, X1 = CT = contract type, X2 = JOB = job specification, X3 = NW = number of wells, X4 = RIG = rig deployment, X5 = WB workboat deployment, X6 = SEASON = season when the work began, and X7 = WOW = waiting on weather.
The number of days to complete the job and the number of wells are numerical variables, while the contract type, job specification, rig and workboat deployment, season of the operation, and waiting on weather are categorical variables, defined in terms of binary indicators:
- Day-rate contract, CT = 0.
- Turnkey contract, CT = 1.
- T&A operation, JOB = 0.
- P&A operation, JOB = 1.
- Rigless operation, RIG = 0.
- Rig operation, RIG = 1.
- Workboat not employed, WB = 0.
- Workboat employed, WB = 1.
- Apr. 1-Oct. 31, SEASON = 0.
- Nov. 1-Mar. 31, SEASON = 1.
- No weather interruption, WOW = 0.
- Weather interruption, WOW = 1.
In a turnkey contract, the service company accepts most of the risk of the operation, so that the CT coefficient should have a positive value.
T&A operations generally are simpler than P&A jobs. Therefore, if all other factors are held fixed, the JOB coefficient should have a positive value.
As the number of wells increase, the total cost and time for the operation should increase. Also the costs will increase if a rig or workboat encounters weather days. The model coefficients of RIG, WB, and WOW should therefore be positive.
The season in which the job is performed may influence the time and cost to perform the service. The summer season should have less operational delay and the model coefficient for SEASON should be positive.
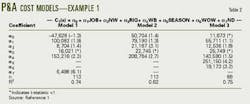
Table 2 shows the results for P&A costs for three models.
Model 1 differs from Model 2 because Model 1 includes the ND variable. The models did not include seasonal and waiting-on-weather variables because these data were not available for all the jobs.
Model 3 has a data subset that included waiting-on-weather data.
Table 3 shows P&A cost functionals for job data decomposed according to contract type and job specification.
As an example, the cost estimate of a four-well, 15-day, turnkey P&A contract in July with a rig and a workboat is as follows:
C1(s) = 30,051 + 6,510(4) + 36,241(1) + 112,715(1) – 9,284(0) + 8,562(15) = $333,500.
Structure removal
To remove a platform from the OCS, an operator needs to submit a structure-removal application and site-clearance plan to the US Minerals Management Service (MMS). If explosives are used for cutting, the decommission operation also requires an Endangered Species Act Section 7 consultation.
Decommissioning involves the removal of piles, conductors, and caissons that attach the jacket to the seafloor. These must be severed and removed to at least 15 ft below the mudline.
The analysis updated, filtered, and reprocessed the data set described in Reference 2 to estimate structure removal cost. Data included projects performed during 1998-2003 and managed by Twachtman Snyder & Byrd Inc. The analysis excluded multiple project jobs.
The 50 jobs in the data set included 45 that involved the removal of a well protector or fixed platform and 12 that had structures placed in a reef program. Four of the reefed structures were toppled-in-place or partially removed.
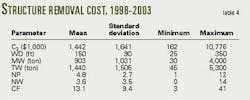
Table 4 shows that the average removal cost for a structure is about $1,000/ton.
The ratio of removal cost to total weight is categorized according to structure type and water depth exhibits economies of scale. On a per-ton basis, the cost for removing a ton of caisson is almost twice as much as the cost for removing a ton of well protector or fixed platform (Table 5).
As water depth increases, the cost- per-ton decreases, and therefore on a weight-normalized basis, the removal cost should be a negative function of structure type and water depth.
Equation 2 describes the removal cost of a structure through a linear specification.
In the equation X1 = ST = structure type, X2 = Wd = water depth (in feet), X3 = CF = complexity factor, X4 = MW = maximum component weight (in tons), X5 = TW = total structure weight (in tons), X6 = REEF = structure disposition, and X7 = TOW = reef removal method.
The water depth, complexity factor, maximum component weight, and total structure weight are numeric variables. Structure type, structure disposition, and removal method are binary indicators.
Structure type distinguishes between simple and complex structures through an indicator variable, ST = 0 for a caisson and ST = 1 for other structures. The complexity factor (CF) is a counting measure that counts the number of conductors (Nc), pipeline attachments (Npl), piles (Np), and skirt piles (Nsp), associated with the structure, so that:
CF = Nc + Npl + Np + Nsp
MW= max (Wd, Wj) estimates the derrick barge (DB) lift capacity required to remove the structure. In this relationship, Wd and Wj denote the deck and jacket weight.
The deck size, equipment weight, number of modules, and number of piles and conductors determine the weight, size constraint, and number of cargo barges required for the operation. The total weight of the structure (TW) is defined as the weight of the deck and jacket, plus the weight of equipment (We), piling (Wp), and conductors (Wc):
TW = Wd + Wj + We + Wp + Wc
If an operator donates a structure to a reef program, the binary variable REEF indicates the disposition as either REEF = 0 for onshore removal or REEF = 1 for artificial reef donation. The binary variable TOW specifies the manner in which the structure is donated as an artificial reef. TOW = 0 if the structure is toppled-in-place or partially removed. TOW = 1 if the structure is towed to site.
The total structure-removal cost should increase with structure complexity, and therefore ST and CF should have positive coefficients. As the maximum component weight and total structure weight increase, the decommissioning cost should increase. But if the operator donates the structure to an artificial reef program, the cost should decrease.
Thus TW should have a positive coefficient and REEF should have a negative coefficient.
Structures toppled-in-place and partially removed should save more costs than a towed structure, and therefore TOW also should have a negative coefficient.
Table 6 shows the functional relations for removal costs. About half of the variables are statistically significant. The most significant variables include the total weight and operator participation in a reef program. Water depth exhibits a consistent negative coefficient for each of the models constructed.
Table 6 includes four models for removal cost with broadly consistent results. Removal cost generally increases with structure complexity and total weight and decrease with water depth, reefing, and disposition options.
Model 4 reestimates the model after the removal of four partially abandoned and toppled-in-place structures from the data set.
As an example, the cost to remove an eight-pile, 980 ton (TW = 980), four well, fixed platform (ST = 1) in the central gulf that is in 210 ft of water and has two pipeline connections (CF = 14) is estimated as:
C2(s) = 1,029 + 292(1) – 4.8(210) + 0.65(980) + 10.9(14) = $1.10 million
A donation to a reef program would lower the structure removal cost to $805,000, while a partial abandonment or toppling in-place would further lower the cost to $674,000.
Site clearance, verification
A site may have various materials that were lost during construction and operations.
These materials can include boat moorings that have failed, leaving anchors and ground tackle (chain, cable) on the seafloor.
Other items may be tires, commonly used as fenders on service vessels and platforms, and supplies dropped overboard during the transfer from supply vessels.
Site clearance is the process of eliminating or otherwise addressing potentially adverse impacts from debris and seafloor disturbances, while verification ensures that the site is clear of obstructions. For clearance purposes, the operator has to clear all abandoned well and platform locations in water depth shallower than 300 ft of all obstructions present as a result of oil and gas activities.
Clearance radii are defined as follows:
- A 300-ft radius circle centered on the well for exploratory or delineation wells drilled with a mobile offshore drilling unit.
- A 600-ft radius circle centered on a single-well caisson.
*A 1,320-ft radius circle centered on the platform geometric center.
Clearance verification involves trawling if the platforms and single-well caissons are in water shallower than 300 ft. The MMS's preferred verification technique is to drag a standard trawl net across 100% of the site in two directions.
Site clearance and verification (SC&V) costs are estimated using data from about 300 jobs performed by B&J Martin Inc. from 1997-2001.3
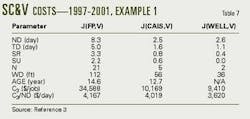
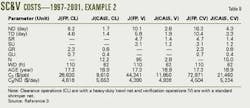
Tables 7 and 8 show the operational statistics for verification (V), clearance (CL), and clearance and verification (CV) operations for fixed platform (FP), caisson (CAIS), and well (WELL) jobs.
The time involved to clear a site depends on the amount, size, and type of debris present, the equipment available to perform the operation, and the water depth.
Older and more complex structures, especially development and manned production facilities, normally have more targets that are identified and removed, and therefore the age of the structure and its configuration type is a factor in the cost of the operation.
The number of days (ND) to perform clearance and verification services for platforms is about three to four times the number of days for caissons and delineation or exploratory wells. The SC&V cost for a platform is about three times the SC&V cost for caissons and wells.
Complex structures should have more debris at the work site, and MMS regulations require the site to be trawled over a larger area.
If the time to perform a service is primarily determined by the structure type, then one would expect (all other things such as location, age, amount of debris present, and water depth being equal) that the time for site clearance and verification for a platform would be about five times greater than for a caisson because the trawling area for a platform exceeds the area for a caisson by a factor of about five:
Area(FP)/Area(CAIS) = π(1,320 ft)2/π(600 ft)2 = 4.8
Because "all other things" are usually not equal, however, this value serves only as an approximate baseline.
SR, SU, GR, and GU denote the number of repairable and unrepairable shrimper and gorilla nets, respectively, damaged by trawling. The number of shrimper and gorilla nets damaged across sites previously occupied by platforms is three-four times greater than for caisson sites
The number of items collected (N) provides an indication of the complexity of the task, but because the data do not describe the size, weight, and volume of the debris, the value of enumeration remains limited; for example, a tire and a 12-ft long drillstring both count as "one" item.
For the most part, however, the average number of items collected as a function of structure type behaves as expected, so that platforms have the most debris and delineation and exploratory wells the least.
Verification surveys have an average service cost that ranges from $10,000/job for caissons and delineation wells to $35,000/job for platforms. For clearance and verification services, the cost ranges from $21,000/job for caissons and $73,000/job for platforms.
On a day-rate basis, verification services cost about $4,000/day regardless of structure type, while for clearance and verification, the average service rates are only slightly higher at $4,500-5,200/day, and the total verification services cost is about half the cost for clearance and verification.
The cost to clear a caisson or platform with heavy-duty nets from a trawling vessel averages about $10,000-29,000/job, or $4,600-5,700/day.
Equation 1 describes the cost to clear a site and verify clearance.
In the equation, X1 = AGE = age upon removal (in years), X2 = Wd = water depth (in feet), X3 = ND = number of days, and X4 = N = number of items collected. All the variables are numeric.
Table 9 shows the regression models that estimate the cost to clear and verify a site according to the configuration type and job specification. The strongest correlation of the total cost is with variables that are known only after the operation is complete (ND and N). This obviously limits the use of the functional for predictive purposes.
The results indicate a positive but weak correlation of SC&V cost with the factors AGE and Wd. Inclusion of the descriptor variable ND will enhance significantly the model fits because of the day-rate basis of the contracts.
The estimated costs to clear and verify a 24 year old, eight-pile, fixed platform and a 15-year-old caisson in the central gulf in 210 ft of water (Wd = 210) are:
C3(FP) = $6,104 + 1,648(24) + 195(210) = $86,606,
C3(CAIS) = –$3,873 + 457(15) + 269(210) = $59,472.
Allocating working interest ownership
Each lease in the gulf has one or more operators and one or more working interest owners. The numbers of working-interest owners varies with merger and acquisition activity as new companies form and enter the region and as other companies withdraw, exchange, or sell properties.
Lease operators typically are from the owner set but third-party service companies (non-owners) also operate structures. Typically, a lease has one operator and multiple owners. The operator is usually the company with the largest ownership share.
Equation 4 assigns each owner with its portion of the number of active (producing), idle (non-producing), and auxiliary (never producing) structures, total decommissioning cost, and present value of decommissioning liability.
In the equation, pl(Oi) denotes owner Oi's working interest in lease l, 0 ≤ pl(Oi) ≤ 1, while ψ(l) is computed according to the number of structures and the generalized cost relation. This summation is for all leases in the gulf.
Ownership patterns
At yearend 2003, the gulf had about 319 reported working-interest owners but ownership is constantly in flux. It is, therefore, important to realize that the data reported represents a "snapshot" of conditions in 2003.
The majority of companies in the gulf are small, independent operators, but these firms do not contribute significant production. Twenty-one companies account for almost 80% of the gulf's production in 2003, with four majors providing more than 40% of the production.
Thirty companies hold 80% of the structures in the gulf (Table 10), and industry consolidation continues. For example in 2004, Anadarko Corp. sold all of its shallow water assets (241 blocks, 78 fields) to Apache Corp. for $1.312 billion, Denbury Offshore Co. sold all of its gulf assets (38 blocks, 16 fields) to Newfield Exploration Co. for $200 million, and BP America Production Co. sold its South Pass 60 acreage (7 blocks, 9 leases, 9 structures, 125 wells) to SPN Resources LLC for an undisclosed amount.
Decommissioning liability estimates
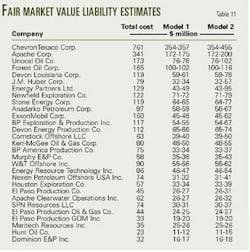
Table 11 shows the total decommissioning cost of gulf structures, according to the total undiscounted cost and two limiting regulatory policies. The table presents the fair market valuation of the total decommissioning cost for the latest possible removal scenario (Model 1) and the earliest feasible removal option (Model 2) under a common 10% discount rate.
A reasonably strong correlation exists between the total number of structures owned by a company and the total decommissioning cost. The fair market decommissioning cost is about 50% of the total (undiscounted) cost.
Variation in the cost distribution results from the timing of removals. Model 1 cost distribution is constrained due to the governing removal requirements.
References
1. Kaiser, M.J., and Dodson, R., The cost of plug and abandonment operations in the Gulf of Mexico, Center for Energy Studies, Louisiana State University, Baton Rouge, December 2003.
2. Kaiser, M.J., Pulsipher, A.G., and Byrd, R.C., "Study estimates Gulf of Mexico decommissioning costs," OGJ, Oct. 6, 2003, pp. 39-47.
3. Kaiser, M.J., Pulsipher, A.G., and Martin, J., "The cost of site clearance and verification operations in the Gulf of Mexico," ASCE Journal of Construction Engineering and Management, Vol. 131, No. 1, January 2005, pp. 117-26.
