US refiners continue to process crudes with lower gravity, higher sulfur
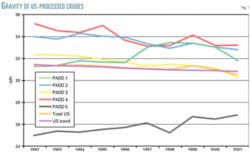
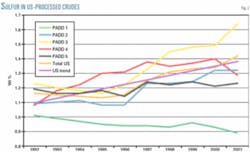
The gravities of crude oils processed in US refineries have slowed from a previously rapid decline in quality to a decrease of 0.10° API/year during 1994-2003. In that same period, there was a moderate increase in sulfur content of the lower-quality crudes, about 0.038 wt %/year.
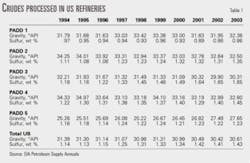
The US Energy Information Administration (EIA) began reporting monthly and yearly composite values of °API and sulfur content of crude oils processed within five Petroleum Administration for Defense Districts (PADDs) 20 years ago. Table 1 shows the latest 10-year (1994-2003) historical composite values of API gravity and sulfur content of crude oils processed by refineries in the five PADDs. For a diagram of PADDs, see OGJ, Aug. 2, 2004, p. 53.
This article updates a previous one on gravity and sulfur contents of crudes (OGJ, Nov. 18, 2002, p. 40) and contains 10 years of data including 2003 information.
A review of historical data for crude oil gravity and sulfur content was made to see if there were any trends that would indicate if poorer-quality crudes were being processed.
Table 1 and Figs. 1 and 2 show API gravity and sulfur data for all PADDs and the entire US for the past 10 years.
These factors determine crude oil quality processed in US refineries:
- Crude types available, whether from domestic or foreign sources.
- Refinery configuration, whether they can handle crude oil quality variations.
- Crude-quality price structure.
- Marketable product slate, whether it can give reasonably good refinery operating margins.
PADD 1
Refineries operating in PADD 1 increased the use of foreign crude oils to 98.2% in 2003 from a low of just more than 80% in the early 1980s.
East Coast refineries are light, sweet-crude processors that mainly produce light transportation products for the massive local consumption. Refinery owners are reluctant to invest in bottom-of-the-barrel conversion units to handle heavy crude oils. Also, East Coast refiners continue to process reasonable-quality crude oils due to the availability of light, sweet crudes at small marginal costs vs. poor-quality crudes.
These management decisions resulted in a mild increase of 0.05° API/year between 1994 and 2003. During this time, refiners processed more medium-light crudes, which lowered the sulfur content by 0.011 wt %/year.
Crude oil quality trends during 1999-2003 indicate that gravity decreased by 0.31° API/year and sulfur content declined by 0.027 wt %/year.
Here are a few important statistics for PADD 1 refineries in 2003:
Crude runs were 1.605 million b/cd, an increase of 64,000 b/cd from 2002 crude runs. The increase was mainly due to the refineries operating at higher rates in 2003.
Refineries operated at 92.7% of operable capacity, mainly due to slight increases in product demand.
Refinery crudes processed had a composite gravity of 32.38° API and a sulfur content of 0.86 wt %.
Foreign crude oil receipts were 1.587 million b/cd, an increase of 85,000 b/cd from the 2002 level.
The top six imported crudes were from Nigeria (347,000 b/cd), Angola (224,000 b/cd), Saudi Arabia (213,000 b/cd), Canada (210,000 b/cd), the UK (123,000 b/cd), and Gabon (116,000 b/cd).
Domestic crudes include those from New York, Pennsylvania, Virginia, and West Virginia, as well as several Eastern states in PADD 2. Foreign crudes account for about 98.2% of crude, 82% of which are received in tankers.
PADD 2
Refineries in PADD 2 increased imports of foreign crude oils to 47% of total crude charged in 2003 from the low 20% range in the mid-1980s. Crude quality dropped off moderately during the past 10 years, a decrease of 0.18° API/year, but with a moderate increase in sulfur content, 0.032 wt %/year.
Crude quality trends during the last 5-year period were fairly constant with a decrease in gravity of 0.19° API/year and an increase in sulfur content of 0.021 wt %/year. This is due to increased use of imported medium gravity, medium-sulfur crudes vs. a mix of higher gravity, lower-sulfur crudes during the past 5 years.
Important statistics for PADD 2 refineries in 2003 include:
- Crude runs were 3.212 million b/cd, an increase of 2,000 b/cd from 2002 crude runs.
- Refineries operated at 91.6% of operable capacity.
- Crudes processed had a composite gravity of 32.50° API and a sulfur content of 1.35 wt %.
- Refiners imported foreign crudes at a rate of 1.453 million b/cd, a decrease of 41,000 b/cd from 2002 imports.
- Top six imported crudes into PADD 2 were from Canada (994,000 b/cd), Saudi Arabia (180,000 b/cd), Nigeria (81,000 b/cd), the UK (35,000 b/cd), Colombia (29,000 b/cd), and Venezuela (29,000 b/cd).
Domestic crude receipts have been steady in the low 50% level for the past 5 years. Nearly all domestic crudes are shipped to PADD 2 refineries through pipelines.
Although refiners report that all imported foreign crudes are received via pipeline, this is done to avoid double counting. An offshore terminal receives imports (excluding Canadian crudes) via tanker then sends them via pipelines to refineries.
PADD 3
Refineries operating in PADD 3 increased their use of foreign crude imports to 71.7% in 2003 from the upper 20% range in the mid-1980s. Crude quality dropped off quickly in the 10-year period between 1994 and 2003, by 0.24° API/year. Sulfur content increased by 0.06 wt %/year during the same period.
Between 1999 and 2003, crude quality decreased by 0.32° API/year and sulfur increased by 0.05 wt %/year.
Crude production in PADD 3 hit a low of 3.12 million b/cd in 1995 and has increased to 3.186 million b/cd in 2003. PADD 3 refiners, however, must still import more foreign crudes to meet increased crude runs.
There are five joint ventures between US and other countries in the PADD 3 Gulf Coast region. Crudes from Mexico, Saudi Arabia, and Venezuela are major sourcing countries to these five joint-venture operations.
These crudes have a medium-heavy API gravity and medium sulfur content, which worsened the average crude characteristics processed in PADD 3 refineries. The joint-venture refineries are modifying their equipment to process crude oils from Mexico and Venezuela, which should continue the trend of lower API gravity and moderate sulfur content.
Important statistics for PADD 3 refineries in 2003 include:
- Crude runs increased by 223,000 b/cd to 7.332 million b/cd.
- Refineries operated at 93.6% of operable capacity.
- Crudes processed had a composite gravity of 30.31° API and average sulfur content of 1.65 wt %.
- Imports increased by 331,000 b/cd to a total of 5.490 million b/cd.
- The top six foreign crude oils imported were from Mexico (1.472 million b/cd), Saudi Arabia (1.081 million b/cd), Venezuela (1.068 million b/cd), Nigeria (400,000 b/cd), Iraq (343,000 b/cd), and the UK (200,000 b/cd).
Domestic crude receipts gradually fell to 28.3% in 2003 from 31.4% in 1999 due to less crude production in the lower South Central states. Pipelines transported more than 89% of domestic crudes to PADD 3 refineries.
About 79% of foreign crude imports come directly to Gulf Coast refineries via tankers. The remainder of imports come in via tankers at Gulf Coast receiving terminals and are then transferred to inland refineries via pipeline.
PADD 4
Refineries operating in PADD 4 are isolated from imports other than Canadian crudes. Refineries process crudes from Colorado, Montana, Utah, and Wyoming. Rocky Mountain refineries processed 44.8% Canadian crudes in 2003, an increase from 10% in the mid-1980s.
Crude quality has dropped off moderately during 1994-2003, about 0.17° API/year, with a moderate increase in sulfur content, 0.017 wt %/year.
Crude-quality trends in the 5-year period between 1999 and 2003 differed slightly from the 10-year trends. Crude quality decreased to 32.80° API in 2003 from 34.10° API in 1999, creating a rate change of 0.028° API/year. The increase in sulfur rate stabilized at 0.016 wt %/year.
High gravity, low-sulfur crude production in PADD 4 has dropped off about 14,000 b/cd/year in the past 5 years. This loss of high-quality domestic crudes is being replaced by Canadian crude imports. The decrease in API gravity and increase in sulfur levels of crude oils processed in PADD 4 should therefore continue.
Important statistics for PADD 4 refineries in 2003 include:
- Crude runs were 528,000 b/cd, an increase of 8,000 b/cd from 2002 crude runs.
- Refineries operated at 91.9% of operable capacity.
- Crudes had a composite gravity of 32.80° API and a sulfur content of 1.45 wt %.
- Refineries imported 250,000 b/cd from Canada, an increase of 21,000 b/cd vs. 2002 levels.
Domestic crude receipts fell to about 55% in 2003 from nearly 68% in 1999 due to a decline in domestic crude oil production in Rocky Mountain states.
More than 87% of the domestic crude was shipped to refineries via pipelines. Remaining domestic crudes arrived at the regional refineries in trucks.
PADD 5
Refineries operating in PADD 5 increased the amount of imported crudes to more than 32% in 2003 from about 14% in 1980. Crudes processed in this region had an API gravity averaging about 26.28° API during the past 10 years; annual values varied between a high of 27.65° API in 2003 to a low of 25.22° API in 1998.
API gravity has increased by 0.26° API/year from 1994 to 2003. Crude sulfur content increased moderately by 0.008 wt %/year. During the 5-year period from 1999 to 2003, API gravity increased by 0.30° API/year and the sulfur content has decreased slightly by 0.001 wt %/year.
Because crude production in PADD 5 has decreased by 166,000 b/cd/year during the past 5 years, refiners need to import more crude to meet refinery requirements. The fall in crude production is mainly from Alaskan North Slope (ANS) fields, about 83,000 b/cd. No Alaskan crudes were shipped to other PADD districts nor exported in 2003.
Two refineries in Hawaii process crudes from the Pacific Rim, the Middle East, and some ANS. Pacific Northwest refiners use ANS and Canadian crudes. California refineries process crudes from California and ANS. California crudes are of a rather poor quality: 25.0-26.0° API and sulfur of 1.05-1.10 wt %.
Saudi Arabia, Ecuador, and Iraq are major importers to PADD 5. Because foreign crudes currently account for more than 32% of crude runs, these medium gravity, medium-sulfur crudes improve overall crude quality in PADD 5.
Important statistics for PADD 5 refineries in 2003 include:
- Crude runs were 2.627 million b/cd, an increase of 60,000 b/cd from 2002.
- Refineries operated at 91.3% of capacity.
- Crudes processed had a composite gravity of 27.65° API and a sulfur content of 1.23 wt %.
- Foreign crude oil receipts were 884,000 b/cd, an increase of 129,000 b/cd from 2002.
- The top six imported crudes came from Saudi Arabia (257,000 b/cd), Ecuador (108,000 b/cd), Iraq (105,000 b/cd), Canada (67,000 b/cd), Argentina (54,000 b/cd), and Mexico (45,000 b/cd).
- Alaskan crude oil receipts were 971,000 b/cd, a 1.9% increase from 2002.
Domestic crude receipts fell to about 67.7% in 2003 from 75.9% in 1999 due to lower production levels in California and ANS regions. California crudes are shipped to refineries by pipeline and ANS crude is shipped via tankers. All foreign crudes enter refineries in California and Hawaii by tankers.
Total US
The quality of crudes processed in the US has slowed from a rapid decrease to a decline of only 0.10° API/year in 2003 during the past 10 years. Sulfur content has moderately increased to about 0.038 wt %/year over this 10-year period.
Crude quality in the 5-year period between 1999 and 2003 nearly doubled from the 10-year rate, and now runs at a decrease of 0.20° API/year. Sulfur content for this period has increased slightly, at 0.027 wt %/year. These changes suggest that imported crudes replacing the decreasing domestic production have lower gravities and slightly higher sulfur content.
In 1999, imported crudes averaged about 8.731 million b/cd, whereas 2003 imported crudes averaged about 9.665 million b/cd; the increase a direct result of decreasing domestic crude production.
Table 2 shows the distribution of imported crudes according to gravity for the past 5 years. Crude imports should follow a similar distribution in the near term. During the next 5-10 years, however, imports may include more heavier crudes due to:
- A worldwide increase in crude demand, mainly in Pacific Rim countries.
- Price spreads in crude oil grades.
- Political stability of crude producing countries.
- Decreased production of high gravity, low-sulfur crudes.
The top six countries that imported crude to the US in 2001 were Saudi Arabia (1.726 million b/cd), Mexico (1.569 million b/cd), Canada (1.549 million b/cd), Venezuela (1.183 million b/cd), Nigeria (832,000 b/cd) and Iraq (481,000 b/cd). These six countries supplied 75.9% of the imported crude oils in 2003.
The US imported crude from 37 different countries in 2003. Table 3 shows a 5-year history of major foreign crude oils imported into the US.
Iraq exported about 1.160 million b/cd of crude in 2003, 41.5% of which was imported into the US.
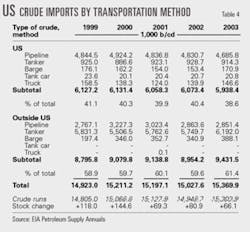
Table 4 lists US receipts of crude according to transportation method. Domestic crude receipts gradually fell to about 38.6% in 2003 from about 41.1% in 1999. Refineries receive about 79% of domestic crudes by pipeline. Rail tank cars and trucks account for 2.8%.
Foreign crude receipts have increased to about 61.4% in 2003 from 59% in 1999. When US refinery crude runs increase and domestic crude production falls off, the crude deficit is supplied by greater quantities of imported crude oils.
Pipelines deliver the majority of Canadian crudes and some Mexican crudes. Other Canadian and Mexican crude oils and all other offshore crude oils are shipped via tanker to coastal refineries and coastal crude receiving terminals. Crudes at these terminals then transfer to inland refineries via pipelines.
The author
Edward J. Swain is an independent consultant in Houston. He is retired from Bechtel Corp., where he was a process planning engineer. Before joining Bechtel, he worked for UOP LLC and Velsicol Chemical Corp. Swain holds a BS in chemical engineering and an MS in business and engineering administration, both from the Illinois Institute of Technology, Chicago.


