Baton Rouge
A study of idle oil and gas structures in the Gulf of Mexico has found that at yearend 2003, the gulf had 2,175 active structures, 1,227 idle structures, and 505 auxiliary structures.
US federal regulations require that operating companies clear all structures on Outer Continental Shelf (OCS) offshore oil and gas leases within 1 year after production on the lease ceases. Recently, the US Minerals Management Service (MMS) has encouraged companies to remove in a timely manner idle structures from leases no longer on production.
Gulf of Mexico
The US OCS in the gulf is the most extensively developed and mature offshore petroleum province in the world. Companies have drilled more than 40,000 wells in the area since offshore production began in 1947, and placed more than 6,300 structures in water depths up to 7,000 ft.
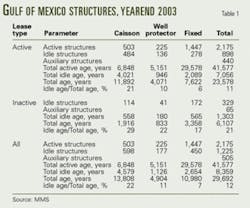
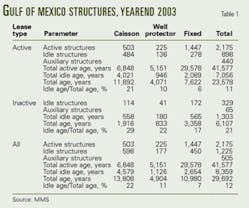
At yearend 2003, the gulf had 2,175 actively producing structures, 898 idle nonproducing structures, and 440 auxiliary never-producing structures on 1,356 active leases; and 329 idle structures and 65 auxiliary structures on 273 inactive leases (Table 1).
Table 2 shows the distribution of active and idle structures by water depth, planning area, and structure type.
Offshore structures eventually become a liability when the operating cost (maintenance, operating personnel, transportation, fuel, etc.) exceeds the income from production. But a company can extend the field life of a structure if it increases production rates through investment or reduces operating costs through more efficient production practices, a farmout arrangement, or unitization.
Offshore structures represent a significant capital investment and companies try to maintain the structures as long as possible unless economic, external causes (such as hurricanes, fire, etc.), operator preference, or regulatory requirements force their removal.
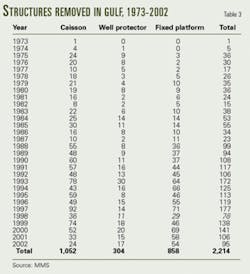
Since 1947, companies have removed more than 2,300 structures from the gulf, and during the past decade removals have averaged about 125 structures/year (Table 3).
Idle iron
Federal regulations require the removal of all structures on a lease within 1 year after the lease is terminated.1 Typically, a lease is terminated when production on the lease ceases. But MMS may grant an extension of the lease termination if the operator intends to rework wells or pursue additional drilling activity on the lease, or if the lease contains an active pipeline. Because a lease may have several structures, the regulations only require removal of all structures when the last structure on a lease ceases production.
Operators may plug and abandon non-producing wells and remove isolated structures such as caissons and storage facilities on a productive lease early, if the removals can be scheduled to enhance economies of scale. But federal regulations require all the structures to be removed only after the termination of a lease.
Structures that exist on a lease that have not produced in the last year or serve a useful economic function are called "idle iron."
Idle iron determination
A trade-off exists in the investment required to build and install infrastructure vs. the production rate. A high production rate requires a larger capital investment in the form of the number and type of wells drilled, structure facilities, and the processing equipment capacity.
A large investment also requires a high rate of return to justify the increased capital risk and exposure; therefore, operators often use the perceived risk-reward trade-off to determine the optimal production capacity of the field.
In every field development, well production begins and ends at different periods of time, and therefore some wells will become idle before production ceases on the lease. Idle wells sometimes are used as injection wells in marginal production. Structures that process and treat production will become idle unless additional wells are drilled or the function of the structure changes.
Incentives companies have to remove their idle structures in a timely manner include:
- Avoidance of environmental and operational hazards.
- Reduction of inspection and maintenance requirements.
- Reduction of insurance premiums and liability.
- Maintenance of good working relations with MMS.
On the other hand, operators also have a strong economic incentive to hold structures offshore to defer removal cost, increase resale opportunities, reduce the risk and expense of storing platforms in a fabrication yard, and reduce the overall decommissioning cost through economies of scale, scheduling, and shared mobilization.
Idle iron thus depends upon operator preference and strategic objectives.
The occurrence of idle iron is also closely connected to legislative requirements. In federal waters, the end of life for a structure is generally defined as 1 year after production activities on the lease cease. Federal regulations employ the lease as the basic unit of analysis, but this is not the only choice because the regulations also could have used a field or structure categorization.
Texas in its state waters, for instance, requires removal of oil and gas infrastructure only upon depletion of the associated field. Because a field may overlap more than one lease, a company can hold structures contained in a nonproducing lease by field production in much the same way as lease production can hold idle structures in federal waters.
The selection of the lease as the basic unit is an attempt to balance decommissioning costs with efficiencies associated with economies of scale. A field unit provides maximum operational efficiency and development options but is also likely to promote a large inventory of idle iron.
A categorization unit selected on a structure basis would induce a smaller inventory of idle iron but at the expense of reduced efficiencies and significantly greater decommissioning costs. The presence of idle iron thus depends on the categorization unit employed in federal regulations.
Active structures
Total operator experience in the gulf for all active structures is 41,577 years (Table 1). The average age of active caissons, well protectors, and fixed platforms is 13.6, 22.8, and 20.4 years, respectively. The total idle age of caissons, well protectors, and fixed platforms on active gulf leases is 7,056 years.
The gulf has more idle caissons than well protectors and fixed platforms combined, so that it is not surprising, therefore, that the total idle age of caissons exceeds the idle age of well protectors and fixed platforms.
The average idle age per structure type is roughly comparable across structure type: 8.3 years for caissons, 7.0 years for well protectors, and 7.5 years for fixed platforms. As a percentage of total age, idle caissons have remained inactive for about one fifth of their life, while well protectors and fixed platforms have remained idle for less than 10% of their life.
Inactive structures
Structures removed from the gulf are drawn primarily from the inactive-lease category. Inactive leases represent an inventory of structures that are likely to be decommissioned in the near future. The near future can only be inferred, however, from the average idle age.
The average idle age for structures on inactive leases is 4.9 years for caissons, 4.4 years for well protectors, and 3.3 years for fixed platforms. This indicates that the inventory of idle structures is reasonably young and will clear on average within 3-5 years.
This is consistent with the storage data and removal trends observed in the gulf. For instance, if companies remove on average 125 structures/year from the 394 idle structures found, they will need about 3 years to deplete the inventory.
The size of the inactive lease inventory varies with time and depends on the number of structures removed and entering the pool.
Structures on inactive leases represent an inventory of structures that are likely to be removed in the near-term but may not be immediately removed for various reasons such as:
- Operator request for an extension to consider additional drilling opportunities on the lease.
- MMS allowing the operator to hold the structure if it is near an active lease or pipeline.
Quantifying these cases is difficult at best and requires review of documentation or interviews with company personnel.
Inactive leases may have idle and auxiliary structures that still support production activities, and in this case, MMS will not terminate an inactive lease as long as the structures are being used to support production activity.
The gulf has 1,225 idle structures. Nearly three-fourths of the idle iron is on active leases that are held by production and permitted by federal regulation.
The 329 idle structures on inactive leases, about one-third of the total number of idle structures, need to be examined on a case-by-case basis to determine if the structure serves a useful economic purpose.
Active leases
Table 4 shows the number of leases with k active structures. A lease with at least one active structure is by definition an active lease, and the vast majority of active leases, nearly 70%, only have one active structure.
Each row in Table 4 depicts the number of leases with m idle structure. As an example, for k = 1 leases, 773 of the 944 leases have no idle iron, 118 leases have one idle structure, 29 leases have two idle structures, etc. A total of 291 idle structures exist on all k = 1 leases:
Idle structures = 773(0)+ 118(1) + 29(2) + 8(3) + 6(4) + 3(5) + 3(6) +2(7) +2(10) = 291.
The average numbers of idle structures on leases increase with k from 0.31 = 291/944 (1-lease) to 0.58 (2-lease), 1.1 (3-lease), 2.4 (4-lease), 6.0 (5-lease).
A few leases have significant amounts of idle iron. Specifically, two 4-leases hold 13 and 14 idle structures and six 5-leases hold 14, 17, 19, 23, 44, and 55 idle structures. More than 30% of the total number of idle structures are on 48 leases, with four of the 44 leases having more than half.
Inactive leases
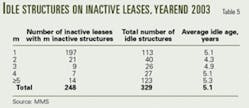
Table 5 shows the number of inactive leases with l inactive structure. The gulf has 273 inactive leases with 248 of these leases once-producing and 25 leases never-producing. Most inactive leases contain one inactive structure, and more than half of the idle structures on inactive leases are on 30 leases.
The average idle time is roughly 5 years/structure for all lease categories. This is consistent with the previous discussion regarding the average idle age of structures on inactive leases.
Ownership patterns
Each lease may have one or more operators and one or more working-interest owners. The number of working-interest owners varies with merger and acquisition activity, as new companies form and enter the region, and as other companies withdraw, exchange, or sell properties. The statistics, therefore, present a snapshot of conditions that existed at yearend 2003.
The operators of a lease are typically drawn from the owner set, but third-party service companies (nonowners) also operate structures. Typically, there are one operator and multiple owners per leasehold, and the owner with the greatest share is usually the operator.
Each owner is assigned its portion of the number of active structures, active age, number of idle structures, and idle age according to the following equation:
null
In the equation, pl(Oi) denotes owner Oi's working interest in lease l and the factor Ψ(l) is taken from the set of active structures, active age, etc.
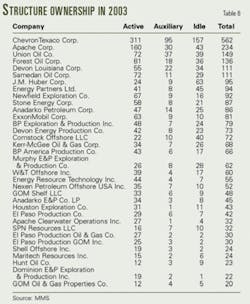
Table 6 depicts the number of active, auxiliary, and idle structures by ownership. The gulf in 2003 had 319 working interest owners and the vast majority were small, independent firms, while 30 companies held 80% of the structures in the gulf.
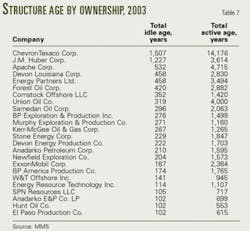
Table 7 lists the total idle age and total structure age by ownership.
Acknowledgment
The study discussed in this article was prepared on behalf of the Minerals Management Service, Gulf of Mexico OCS region, but MMS has not technically reviewed the study. The opinions, findings, conclusions, or recommendations expressed in this article are those of the authors and do not necessarily reflect the views of MMS.
The US Department of the Interior and the Coastal Marine Institute of Louisiana State University provided the funding for the study.
Reference
1. Oil and Gas and Sulphur Operations in the Outer Continental Shelf – Decommissioning Activities; Final Rule, Department of Interior, Minerals Management Service, 30 CFR Parts 250, 256, Federal Register, Vol. 67, No. 96, May 17, 2002, pp. 35398-412.
The authors
Mark J. Kaiser (mkaiser@ lsu.edu) is an associate professor–research at the Center for Energy Studies at Louisiana State University, Baton Rouge. His primary research interests are related to policy issues, modeling, and econometric studies in the energy industry. Prior to joining LSU in 2001, he held appointments at Auburn University, the American University of Armenia, and Wichita State University. Kaiser holds a PhD in industrial engineering and operations research from Purdue University.
Dmitry Mesyanzhinov is a research associate at the Center for Energy Studies at Louisiana State University. His research interests include economic geography, regional economics, statistical modeling, and computer cartography. Mesyanzhinov has BA in geography from the Moscow State University and a PhD in economic geography from Louisiana State University.
