How to use petrophysical data to determine deep prospectivity
This article describes, using petrophysical data, a technique that will define the depth level of commerciality along the US Gulf Coast.
We can eliminate drilling and completing wells with no chance for commercial recovery and find other areas to drill with better odds, particularly the deep wells. It is the author's opinion that all Gulf Coast prospects be evaluated before drilling with the technique described in this article.
The procedure, when used with conventional geophysical, geological, and engineering techniques, will enhance the chances for commercial success considerably and also lower the finding cost for new reserves.
Also, newer drilling and petrophysical techniques such as logging while drilling would have a good application to this procedure.
Background
It's proposed by many in the industry that over the next few years oil and gas demand will far outpace production.1
Much emphasis to find new reserves is now being placed on drilling in "hostile" geological environments or in drilling in mature areas where oil and gas have been bypassed.2
The industry is gearing up to drill deep, expensive wells on the Gulf Coast. Is this wise? Occasionally yes, but more often than not, particularly the deep wells, the answer is no.
Can we determine, with any degree of accuracy, what the probabilities of success will be? Can we rate the quality of the prospects and decide which have a chance for success?
Even after drilling and finding new pays proven up by "state of the art" seismic and log interpretation techniques, can we determine that these new pays will even be commercial? The answer to these questions, utilizing the petrophysical techniques described in this article, is yes.
Today, much of the emphasis in our industry for finding new oil and gas reserves is placed on sophisticated approaches driven by computer technologies with little regard to common sense.
More attention is being put on finding these new reserves in deep sands below 15,000 ft. The majority of these reservoirs will be in high pressure/ high temperature (HP/HT) environments. In fact, the US Minerals Management Service is encouraging deep drilling by offering royalty relief.3
The MMS has projected that the Gulf of Mexico has produced less than half of what will eventually be produced, even though production is declining. Also, the MMS reports that "resources are likely to be revised upwards, due to new discoveries in entirely new geologic formations, such as deep gas targets on the shelf."
It is interesting to note that in a recent article,4 an MMS spokesman pointed out that completions below 15,000 ft "come on very strong, they decline faster, so we need more." The same person also states, "Our scientists, after getting a little bit of data from some wells being drilled deep on the shelf, are convinced that there is a substantial resource in the deep shelf.U"
Is the MMS correct in its projection, or is it just wishful thinking?
Some of us have doubts, and the author believes that areas with deep commercial production are very limited. Costs for drilling these deep wells will be enormous. Drilling and service companies are investing millions of dollars in developing the equipment necessary to drill these wells and the tools to evaluate them.5
The author believes the money we spend on drilling these expensive wells and the tools used to evaluate them, because there is a "deep structure" and an exciting "seismic anomaly," could be spent more prudently in other areas where chances of commercial successes are possible or at least have much better odds.
A recent article in the Houston Chronicle6 reports that drilling and operating companies are gearing up to drill wells below 25,000 ft, within one of the most heavily explored places on earth, "the heart of the Gulf play."
With all the technical information we've already accumulated in the gulf, these data can be used in the manner described in this article to predict the outcome of new drilling with a high degree of accuracy.
Pressures and temperatures
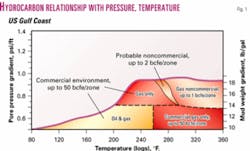
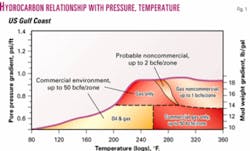
Fig. 1 is an updated and revised plot of the hydrocarbon relationship with formation pressure and temperature for the US Gulf Coast.
Similar plots can be made for other areas of the world.
The author published an earlier version of this figure in 1971,7 and the revised figure is a statistical plot of many hundreds of wells.
Although oil and gas production can be found under almost any pressure/ temperature (P/T) condition, commercial production cannot. Commercial production will fall within this bell-shaped curve.
Also, the quality of production can be predicted in terms of billions of cubic feet per zone. Note that if the temperature exceeds 310° F. (from logs), the formation pressure must be under a maximum 14 lb/gal pressure gradient equivalent for any commercial production.
Any commercial production, therefore, in high temperature environments must have moderate to low pressure gradients. Such reservoirs are extremely rare on the Gulf Coast.
Also, in the above-referenced JPT paper, the author utilized shale resistivity versus depth profiles to determine commercial cutoff depths.
If the shale resistivity of the extrapolated normal shale trend divided by actual values read from the log reaches and exceeds a 3.5 ratio (17 lb/gal) at any depth, the chance for finding commercial production below that depth is nonexistent.
Therefore, utilizing log-derived pressures, temperature relationships, along with log-derived shale resistivity ratios, the commerciality of any Gulf Coast reservoir can be predicted with a high level of accuracy.
The author has observed that predictions from these two petrophysical procedures usually confirm and support each other.
Chocolate Bayou application
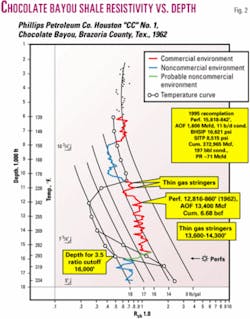
The next step is to apply the procedure (Fig. 2). The figure is a plot of shale resistivity versus depth.
Formation pressures in terms of mud weight equivalents are shown. Also, we have superimposed the temperature curve of Fig. 1. This was done by using bottomhole temperatures from logs and extrapolating between log runs.
This Chocolate Bayou field well was originally completed in 1962 with perforations at 12,816-860 ft. As noted, this completion is in the favorable P/T part of the envelope (red on the figure). This zone produced 6.68 bcf of gas.
In 1995, the well was reperforated at 15,812-842 in a deeper gas sand. Note that this zone falls within the portion of the P/T curve indicated as being in the "probable noncommercial" environment (green shading).
Recoveries for these two zones is a maximum 50 bcf from the upper perforations and a maximum of 2 bcf from the lower. The cumulative gas recovery to date for the lower completion is less than 400 MMcf with the present rate at 71 Mcfd.
The log taken in this well shows potential "thin gas stringers" farther uphole within the favorable P/T environment. Although thin, these zones would likely be better producers than the sand at 15,818 ft.
Note the intervals colored blue on Fig. 2 at 7,700-10,400 ft and below at 16,000 ft to TD. These intervals fall outside the P/T envelope of Fig. 1, and any productive sands found in these intervals would be noncommercial.
Also note that the shale resistivity ratio level reaches and exceeds 3.5 at 16,000 ft, which confirms the P/T envelope that no commercial production can be obtained below this depth in this area.
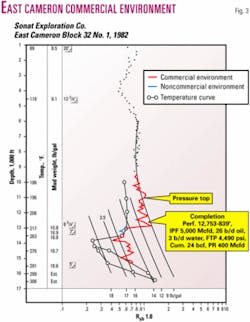
A further application of the technique is illustrated in Fig. 3, an offshore example. This well was perforated and completed in the interval 12,753-839 ft. The zone falls well within the prolific producing envelope of Fig. 1.
Recovery from this zone has been 24 bcf through July 2003. The drilled TD of this well was 15,347 ft, which if the pressure gradient remains the same or increases with depth would give no reason to drill deeper as this well has already drilled through the entire commercial environment.
The point of this example is that using this technique the operator will know when he has reached the maximum depth for commercial production.
Yegua in Wharton County, Tex.
It is extremely important to pay attention to the shales immediately above and below any sands of interest, as they are the key to what kind of production one can expect from the adjacent sand.
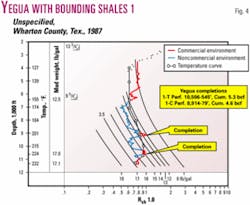
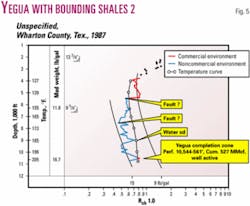
For example, Figs. 4 and 5 are plots from good Yegua sand producers in Wharton County, Tex. These wells are in the same field, and both exhibit a pressure regression in the shales immediately above and below the pay sands.
A Gulf Coast operator8 using this technique has informed the author of its usefulness in evaluating Yegua prospects.
Vermilion Parish, La.
It can be enlightening, using this P/T approach, to evaluate a pay sand that appears to be a good hydrocarbon zone by conventional log and core analysis.
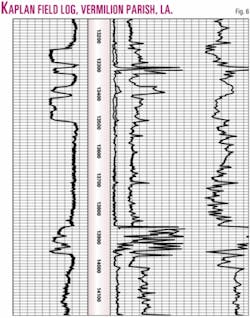
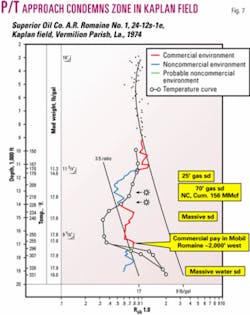
Fig. 6 is a log section from a Kaplan field well in Vermilion Parish, La. The well was completed in the pay sand at 13,860 ft and perforated at 13,861-871 ft. The log shows 60 ft of net pay in this interval, but it depleted after producing only 156 MMcf.
Fig. 7 is the shale resistivity plot for this well with the P/T curve superimposed. Note that the pay at 13,860 ft falls above the P/T envelope, indicating noncommercial pay. The author has no information on the pay sand at 13,310 ft, but as indicated by the plot of Fig. 7, this zone would also be expected to be noncommercial.
An important positive point can be made from the shale resistivity, P/T relationships. Referring back to Figs. 4 and 5, the commercial cutoff depth for either well has not been reached.
There would be a good prospective environment below these drilled depths for about 3,000 ft. In fact, not only is there a chance for pays below the present drilled depths, they would likely be more productive as they would be in the high P/T environment of Fig. 1.
Fons9 recently noted low temperature gradients above gas zones. Gas could be present in some form below these drilled depths, but it could be in shales. This area has become active for prospecting and finding Wilcox sand production to 15,000 ft.
Weeks Island, La., example
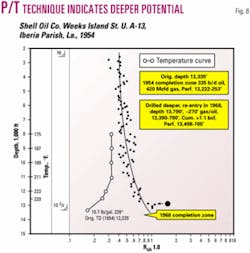
Fig. 8 is a good example where the technique indicates potential production below the drilled depth.
This Weeks Island field well was originally drilled to 13,335 ft in 1954 and perforated and completed as a good oil well with perforations at 13,222-253 ft.
Note the low formation pressure and temperature at TD. The producing reservoir falls well within the "oil envelope" of Fig. 1. The plot shows deeper potential is likely below 13,335 ft.
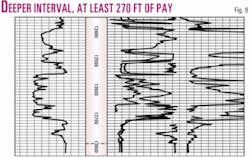
In 1968 this well was reentered and drilled about 500 ft deeper. Fig. 9 is the log section of this deeper interval that exhibits at least 270 ft of net gas pay.
Depth record wells
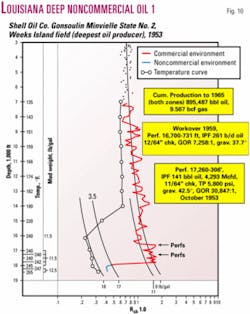
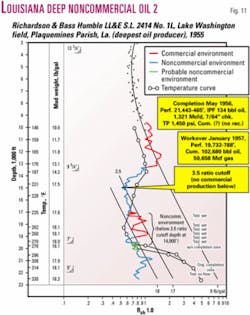
Figs. 10 and 11 are plots from wells that when drilled set the depth record for oil production.
The Fig. 10 well was completed in 1953 with perforations at 17,260-306 ft and recompleted in 1959 with perforations at 16,700-731 ft. Both zones are within the favorable oil environment, and cumulative oil and gas production was 895,487 bbl of oil and 7.567 bcf.
The well in Fig. 11 was completed in 1955 with perforations at 21,443-465 ft and recompleted in 1957 with perforations at 19,732-788 ft. There is no reported production from the lower zone, which falls in the "noncommercial" environment.
The upper zone, which falls within the "probable noncommercial" zone, produced 102,680 bbl of oil and 50.658 MMcf of gas, which at best is borderline commercial, but the value of which would not pay out the drilling, completion, and operating costs of this well.
Note a discrepancy in this case between the P/T and shale ratio cutoff depths. The shale ratio cutoff depth is 15,000 ft. While the P/T technique indicates the interval between 17,000 ft and 19,100 ft as having potential, the author has observed that the shale ratio cutoff approach has proved the more reliable.
The low temperature gradient above 20,000 ft is likely due to the presence of deeper gas, although in this case it would be noncommercial. Later examples of HP/HT wells will further describe this issue (Figs. 17 and 18).
Southeast Gueydan, La.
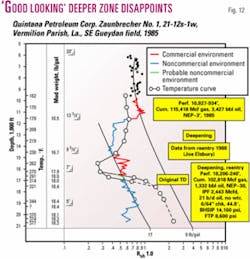
Fig. 12 is an example of a well drilled to 17,000 ft by one operator and completed in a thin gas sand at 10,927 ft.
When the thin sand depleted, another company assumed operations and reentered it as a deepening prospect to a depth of 20,650 ft.10 The well was a discovery and completed with perforations at 18,206-240 ft.
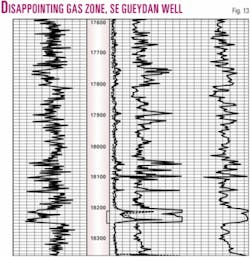
Fig. 13 is a log section showing the newly discovered pay zone, which "looks" very good by conventional log analysis. It was, however, a disappointment as gas recovery was only 102,878 Mcf.
Note that these results could have been predicted from the data from the original hole. At 17,000 ft, the original hole depth, the well had reached the limits of the P/T cutoff, along with reaching the 3.5 shale ratio cutoff.
Elsbury & Acker, the operator of this well, did a good job in the deepening but was disappointed in the production results.
Matagorda County, Tex.
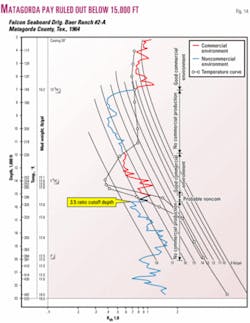
There is considerable interest in the Baer Ranch field in Matagorda County, Tex., and prospects are being evaluated for deep production in that area.
Fig. 14 is a plot from a field well. Apparently the presence of sands with reservoir quality, along with seismic anomalies, and good mud and electric log shows from wells in the area, have piqued the interest of some Texas operators.
The deep production, however, below 15,000 ft in this immediate area would not be of commercial significance. Note from this figure both the cutoff values for shale resistivity and P/T values are reached at 15,000 ft.
The author makes the point that the millions of dollars saved by not drilling wells in such areas could be better spent elsewhere in areas that are prospective.
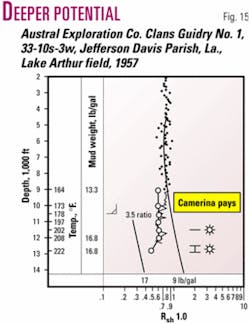
For example, the odds would be much greater for finding commercial deep production in areas exhibiting shale resistivity and P/T profiles as shown in Fig. 15, where P/T and shale ratios have not reached cutoff levels.
Lessons from Zeidman
One of the economic pitfalls in finding deep production that is not in a commercial environment is that because the well appears to be so good from log analysis and initial testing, it kicks off a frenzy in leasing and offset drilling.
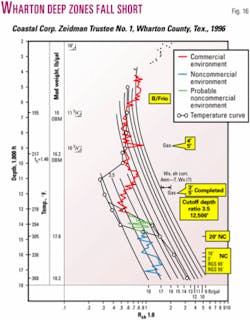
Fig. 16 is such an example. A number of excellent looking pay zones were found in the Wilcox section below 14,500 ft. As the author's technique would predict, all zones tested below this depth depleted on tests or over short periods of time.
Front page headlines in the local newspaper proclaimed that this well when drilled and initially tested was probably one of the biggest discovery wells ever drilled in Texas. Mineral leasing costs skyrocketed in the area, and more deep, expensive, noncommercial wells were drilled. Again, millions of dollars were spent that could have been used in other more prospective areas.
Distinguishing the commercial
We are all aware that excellent production can be obtained in HP/HT environments, and using the author's approach it is possible to recognize the commercial from the noncommercial.
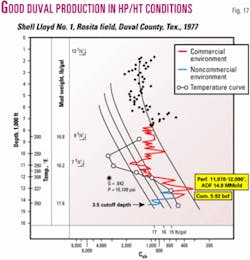
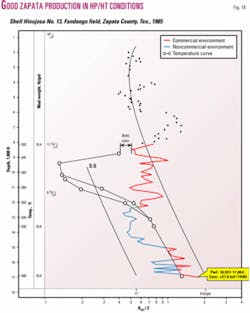
Other authors have written on the subject.11 Eaton termed environments as the "good, the bad and the ugly." Figs. 17 and 18 are examples of good producing wells with HP/HT conditions in South Texas. Fortunately, there is a pronounced difference in the plotted profile of the bad and good wells.
A bad environment is shown by the profile of Fig. 16 in the HP/HT portion of the well below 14,300 ft. Figs 17 and 18 are the profiles that good producers exhibit.
The author has noted that the level of shale resistivity above and below sands of interest is the key in determining the quality of a producing environment. In the case of the good wells, a pressure regression is indicated in the adjacent shales immediately above the pay zones. This has led the author to the conclusion that sands and adjacent shales are often not at the same pore pressure.
Another feature that distinguishes the good and bad environments is that in the shallower portion of the well the shale resistivities do not reach and exceed the ratio value of 3.5 for good wells but do for the bad ones. This can readily be seen by comparing Figs. 11, 16, 17, and 18.
In other words, there is no geological condition on the Gulf Coast, either land or offshore, that the economics, using the petrophysical approach as described, cannot be reasonably predicted.
If we are looking for deep gas production on the Gulf Coast in developed areas, we should first review the petrophysical data from wells producing oil from moderate to deep depths. These would be areas where the entire commercial P/T envelope has not been drilled and deeper commercial gas production is possible.
Using this technique which limits risk, we have the opportunity to take advantage of the royalty relief now offered by the federal government for continental shelf wells deeper than 15,000 ft in already established fields that are producing from shallower zones.
Conversely, we should avoid areas where wells have been drilled deep enough to see the entire commercial portion of the envelope.
References
1. Iskander, Sami, "Logging aids aging fields," Hart's E&P, September 2003, pp. 37-38.
2. Shirley, Kathy, "GOM: Proud past, bright future," AAPG Explorer, September 2003, p. 10.
3. "MMS royalty relief piques interest in the Gulf of Mexico's shallow water," Lagcoe official program guide, Oct. 28-30, 2003, pp. 79-83.
4. Fletcher, Sam, "MMS ups Gulf of Mexico deep gas reserves estimate," OGJ, Dec. 1, 2003, pp. 29-30.
5. Larson, Rod, et al., "Execution requires innovation, planning," Hart's E&P, November 2003, pp. 74-75.
6. "Six miles deep," Houston Chronicle, Sec. D, Aug. 17, 2003.
7. Timko, Don, and Fertl, Walter, JPT, August 1971, pp. 923-933, Fig. 1.
8. Schweikhardt, C.P., American International Energy Corp., Houston, personal communication.
9. Fons, Lloyd, "Finding, mapping temperature anomalies," OGJ, June 4, 2001, pp. 38-42.
10. Elsbury, Joe W., Joe W. Elsbury Oil & Gas, personal communication.
11. Eaton, Ben A., "How to use drilling petrophysical data in prospect evaluation," World Oil, Part 1, September 1995, Part 2, October 1995.
The author
Donald J. Timko (phylko@ aol.com) is a consultant specializing in defining reservoir production quality from petrophysical data. He initiated work on pressure, temperature, and hydrocarbon relationships during almost 2 decades with Conoco Inc. From 1973 to 2000 he was an independent operator. He has been an SPE distinguished lecturer, was president of SPWLA, and has taught seminars on well log interpretation. He is a graduate of the University of Pittsburgh.
