Simulation model determines optimal tank farm design
The Kuwait National Petroleum Co. (KNPC) recently hired Foster Wheeler USA Corp. to complete a detailed tankage and hydraulic study, which would assess the adequacy of existing tank farms at all three KNPC refineries through 2010 and develop a solution to the refineries' tank farm needs.
To perform this detailed study, Foster Wheeler developed a custom tankage optimization model that incorporated refining linear programming (LP) and Monte Carlo simulation techniques.
Based on the analysis KNPC selected a configuration that allows it to transfer finished products from one refinery directly to the loading port of another refinery without going through finished-product tankage first. KNPC will also be able to transfer finished products between refineries (i.e., tank-to-tank transfers) via the existing inter-refinery transfer (IRT) lines.
In addition to dealing with routine operations such as planned unit and plant turnarounds, KNPC wanted enough refinery tank farm capacity and flexibility to handle unplanned events such as a ship delay, power failures, weather problems, unit outages, etc.
The greater number of products a refiner has to process was another issue. The study was even more complex due to tank farm operations of multiple refineries and their effect on overall management of inventory control.
Current configuration
KNPC operates three refineries in Kuwait with a total crude throughput of approximately 900,000 b/d. The refineries are located at Mina Al Ahmadi, Mina Abdulla, and Shuaiba.
Shuaiba is KNPC's oldest refinery and Mina Abdulla is the most modern. Mina Al Ahmadi is the largest and most complex refinery with an FCC, hydrocracker, and petrochemical feedstock preparation units. The three refineries are integrated with IRT pipelines. These pipelines transfer products, feedstocks, and blending streams between the three refineries for optimum utilization of facilities and flexibility in product shipping.
Finished products from the three refineries are transferred to tankers berthed at four different piers: North, South, Shuaiba, and Sea Island. Mina Al Ahmadi products are exported to the North and South piers, Mina Abdulla products are exported to Sea Island, and Shuaiba products are exported to the Shuaiba oil pier.
KNPC uses six IRT pipelines:
- Two 24-in. lines for black oil products.
- Two 20 in. and 24-in. lines for white oil products.
- A 14-in. line for motor-gasoline components.
- A 20-in. line for naphtha or kerosine.
The refineries continuously exchange products for various process activities or blending operations to create products that are ready to export.
In 1986 KNPC completed a modernization project in its Mina Al Ahmadi refinery to provide the local and world markets with low-sulfur petroleum products and to reduce the Kuwait's dependence on gas as fuel. The project increased the yield light and medium products and minimized fuel oil, resulting in a higher refinery return.
Shuaiba produces light, medium, and heavy petroleum products, including light gas, ordinary naphtha, and other fuels such as high-octane gasoline, kerosine, aviation turbine kerosine, automotive diesel, marine diesel, fuel oil, and sulfur. Mina Al Ahmadi and Shuaiba provide the local market with petroleum products.
The most recent modernization project at Mina Abdulla was completed in 1988. The Mina Abdulla refinery modernization project helped integrate this refinery with Shuaiba and Mina Al Ahmadi so that the three facilities could essentially operate as one fully integrated refining complex that would provide a more flexibility in product manufacturing and marketing.
Some smaller projects at the three refineries are in different stages of implementation. KNPC hired Foster Wheeler to conduct a detailed study to determine the adequacy of existing tank farms at all three refineries for operations through 2010 and determine the interim solution to the refineries' needs.
- Outline an interim solution for tankage deficiencies in KNPC refineries before anticipated upgrading and expansion projects in all three refineries are complete in 2008-10.
- Include a simulation to assess the future tankage requirements for KNPC.
- Check, for each refinery and KNPC in general, the adequacy of existing intermediate and finished-product storage capacity, number of tanks, IRT systems, unit charge systems, blending, and dispatch facilities.
- Check the adequacy of the hydraulics and flow metering systems to ensure efficient refinery and export operations.
- Identify additional storage capacity, tankage requirements, and other associated facilities as required to meet overall objectives.
- Identify the modifications required for IRT systems, product blending, process-unit charge systems, and dispatch facilities.
- Assess the benefit of on-line blending and industry best practices for storage and handling.
- Prepare process design packages for any new tanks and identified modifications, with budgetary cost estimates for implementing such recommendations.
Tankage simulation modeling concept
The tankage simulation model would determine the adequate tank storage capacity required for anticipated refinery operations. The model would need statistical risk that reflected refinery off site tank farm operations.
In addition to routine operations such as planned unit or plant turnarounds, the model was designed to account for unplanned events like a ship delay, power failures, weather problems, unit outage, etc.
Operating any industrial facility involves many risks. Some risks are fairly common but have a low consequence. Others may have a low probability but can be quite serious. Whatever the risks, they can be quantified and easily understood.
This field of study, known as "probabilistic risk assessment," helps companies and governments assess whether they have adequately identified the risks and potential consequences involved with operating these facilities. The concepts were developed more than 40 years ago, but recent advances in computing software and power have increased their use and accuracy.
Probabilistic risk assessment in a simulation can help determine the chances of a particular outcome, or set of linked outcomes, based on what is known or estimated about the smaller variables that lead to these outcomes.
Designers use historical data to estimate the relative frequency of those variables, and then apply them in random order to models to determine the impact. By defining the known linkages within a system, the simulation model can handle complexity and is quite accurate.
A key element of the study was the development and use of a tank farm simulation model, which incorporates refining LPs and other models. This simulation was the basis for identifying bottlenecks, additional storage capacity, and modifications required for product receipt, blending, unit charge, and dispatch facilities.
Model design
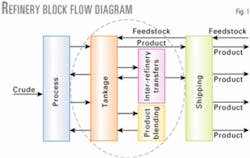
Fig. 1 shows a block diagram of a typical single refinery configuration. The tankage simulation model would cover the area in the dashed oval line.
The tankage simulation model incorporates two distinct modeling techniques. The first technique uses a large multi-period, multi-refinery LP model. The other uses a random event generator, also known as a Monte Carlo simulation.
Foster Wheeler developed the LP model for this study based on the Haverly System Inc. Generalized Refining-Transportation-Marketing Planning System. The model represents planned refinery operations in 2010 and current tankage condition at all three refineries.
The LP model incorporated all current interconnections among the three refineries. The model was initially populated with current tankage, planned unit outages, planned tank maintenance, and pumping limitations.
The model was run for 5 years. To achieve sufficient resolution for proper analysis, the 5-year timeframe was separated into shorter, more manageable time periods. Foster Wheeler chose 260 1-week periods because this approach offers the shortest time period for optimum model performance.
The LP model focused on the tank farm, blending, and shipping operations within the three KNPC refineries, and not on specific refinery process-unit operations. The LP model, therefore, can blend to final product specifications from materials in inventory; although it is limited to major blend specification properties (sulfur, gravity, octane, diesel index, viscosity, etc.).
The LP model is sufficient if plant operations are predictable and steady. Due to the nature of unplanned or emergency process unit outages and shipping delays, the model needed a more dynamic aspect—Monte Carlo simulation. This is a statistical representation of real world events.
The simulation models three types of events, which include unplanned unit or system outages, early port calls, and late port calls by a shipping tanker.
This method is also called stochastic simulation or discrete event simulation and is a powerful and accurate method for solving systems engineering problems. Simplifying assumptions do not constrain this method as with more traditional analytical modeling. Instead, the model runs many "histories" concurrently, each with a different stochastic behavior, and aggregates the results. It is a method that fairly accurately predicts expected system behavior and variation.
The Monte Carlo simulation overlays the LP model and adjusts it to reflect events such as an emergency unit outage, unplanned unit maintenance, or shipping complications.
During model execution, a tremendous amount of data is generated that must be compiled and analyzed. With the assistance of the Haverly staff, Foster Wheeler rewrote the software's report generation feature to capture relevant information related to tank farm inventory management and download it into Microsoft Access. The raw data were then exported into Microsoft Excel for numerical analysis and graphical presentation.
General input data
The simulation model required certain baseline information. In addition to refinery unit operations and production data, the model required available tank pumpable volume, pump capacity, and piping interconnections. Marketing parameters such as product demands and specifications can be added to the base model for a planned production period.
The annual production plan for this study was taken from KNPC's existing LP planning model. That reflects seasonal modes of operation for a representative year. In Kuwait, summer and winter span 7 months and 5 months, respectively. The analysis assumes year 2010 production rates and product specifications.
KNPC also provided monthly demand and product shipment requirements for each refinery. This monthly plan was developed from the KNPC seasonal LP model and production information.
The LP model was initialized with data collected during Foster Wheeler's visit to all three refineries. The process stream rates were taken from KNPC's existing LP planning model output and were used as input flow vectors. Rather than recreate the existing LP planning model, Foster Wheeler used simplified process units with fixed process unit yields.
Units that produce materials that do not affect the tankage and flow hydraulic systems defined in the scope of the study (amine units, sulfur plants) were excluded from the model. The model also excludes unit utilities, streams lighter than propane, and material heavier than fuel oil. Foster Wheeler then ran the LP model in conjunction with the Monte Carlo simulation.
Modeling operation
The tankage simulation model was designed to determine and identify bottlenecks, storage capacity, and modifications required in product receipt, blending, unit charge, and dispatch facilities. Consequently, the simulation model must be able to measure the impact on inventory of planned and unplanned events.
The simulation model ran for a 5-year period in 1-week increments, which corresponds to a typical 5-year planning cycle. One week was the minimum resolution required to evaluate inventory in the tank farms.
The model first ran with only planned outages for process units and the master-shipping schedule to establish a baseline of normal operation. Foster Wheeler then ran the model 10 more times using the Monte Carlo simulation to introduce random unplanned outages. Compiled data included statistical analysis of the model results.
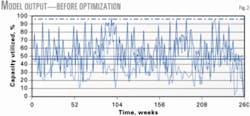
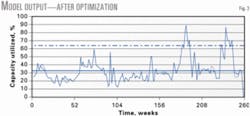
Fig. 2 shows the Base Case before any system configuration changes were made. Fig. 3 shows the improvement after implementing all recommendations.
Individual lines represent specific Monte Carlo simulation runs.
The charts include the mean tank group utilization (uw) and standard deviation (s) of the data set. Assuming a normal probability distribution, lines on the chart represent uw and uw+2s, which indicates that 95.45% of tank group utilization fits below the upper band line.
If the upper band line exceeds 100% capacity utilization, this would indicate that available tankage capacity is not sufficient and would be a potential restriction to tank farm operations. A band line less then 100% capacity utilization indicates that there is sufficient tankage available to deal with normal tank farm operations.
The tankage simulation model measured and recorded:
- Process unit capacity utilization.
- Tankage utilization as a percent of working capacity.
- Frequency that tank filling is constrained by maximum working capacity.
- Product properties and transfer flow rates within the refineries, via the IRTs, and to final product-shipping facilities.
- Ship movements as a result of two-port loadings.
- Product movement operating costs.
- Final product blend values.
- mprovements that result from defined system modifications and expansions.
Case summaries
Foster Wheeler used a stepwise approach to analyze the tank farm operations, with a stated goal to keep recommended capital investments to a minimum.
A series of simulation model runs was performed for each scenario to assess facilities utilization.
Base Case: Current operations
The current refineries' tankage, blending, and shipping configurations were examined given planned 2010 operations.
Base Case modeling indicated that some tanks actually constrain current operations at the three refineries. This results in increased inter-refinery transfers, a significant number of two-port loadings, and reduced process-unit throughput in some cases. Refinery operations are consequently penalized with increased costs.
Nine tanks or tank groups were constraining the operations based on screening criteria developed for this study. These criteria include:
- Average capacity utilization exceeds 50%.
- Average capacity utilization plus 2.3.standard deviation exceeds 100% of tank capacity.
- A high frequency and duration of operating at capacity limits.
Case 1: Reallocate existing tankage
Based on the constraints in the Base Case runs, Case 1 runs were configured so that existing tankage is reallocated to allow reasonable utilization levels within tank groups.
Tankage reallocation decreased IRT use and the number of two-port loadings. Inventory holding costs increased due to tankage reallocation. This is not surprising because underutilized tanks were placed into services where additional tankage was required, thus increasing overall tankage utilization across the three refineries.
Case 2: In-line finished product blending
Automated in-line blending facilities allow finished-product blending as required, rather than the current refinery practice of blending a full batch of inventory before shipping release. In effect, this reduces tank hold-up times.
To represent this practice in the tankage simulation model, Foster Wheeler removed the requirement to build finished product inventory one time period before actual dispatch of a scheduled parcel. Finished product blending and dispatch can occur in the same time period.
Tankage reallocation was incorporated with this case.
Tankage reallocation plus in-line finished product blending decreased significantly the IRT utilization and the number of two-port loadings. Inventory holding costs decreased due to "just-in-time" finished product blending.
Aggregate finished-product inventory decreased, which was offset by a small increase in blend components inventory.
Case 3: IRTs of finished products
Tank-to-tank transfers of finished products between refineries via the existing IRT lines improved the distribution system flexibility. Tankage reallocation and in-line finished product blending were incorporated with Case 3.
The tankage simulation model allows finished-product transfers only when the refinery serving the primary loading port cannot physically supply the required parcel size. Finished products are transferred only when necessary and are uneconomical; KNPC previously indicated a preference to minimize IRT transfers.
Because finished products are shipped along the same lines as intermediate products, IRT lines' use increases. Two-port loadings were entirely eliminated. Inventory holding costs were about the same as Case 2.
Case 4: Eliminate dual-port product loading
This is similar to Case 3, except that finished products from one refinery can ship directly to the loading port of another refinery without going through finished product tankage first.
Instead of tank-to-tank transfers, a refinery can ship finished product directly to a port located near another refinery via the IRT lines. The primary benefit of direct shipment is the savings associated with transferring larger batch sizes. This case incorporated tank reallocation and in-line finished product blending. As with Case 3, IRT line use increased because finished products shipped along the same lines as intermediate products. The incremental amount in the IRT lines was equivalent to the quantity that was previously loaded via the second port in the two-port loading scenario. The size of the batch transfers, however, is much larger than in Case 3.
Two-port loadings were entirely eliminated. Inventory holding costs were essentially the same as Case 2.
The four cases addressed in this study demonstrate the ability to provide adequate and optimum tankage. The recommended changes in facilities, practices, and procedures achieved a reasonable system utilization level. Tankage reallocation makes the best use of available existing storage facilities, whereas in-line blending maintains optimum inventory. Split loading achieves optimum shipping parcels.
Economic benefits
For each case, we identified, quantified, and compared the benefits to the base case. Estimated capital costs for recommended system improvements allowed us to determine a project payout period. Weekly operating costs determined in the tankage simulation model runs were aggregated into annual average costs over a 5-year period. Annual credits for each case were the difference in the average annual operating costs vs. the base case.
Table 1 shows the results vs. the base case. In addition to these credits, we developed supplemental credits (e.g., reduction in blending giveaway, improvement in ship loading times, etc.) offline from the model to capture the balance of realizable benefits for system changes.
Foster Wheeler estimated capital costs from in-house data and previous experience with similar projects and equipment. Foster Wheeler used estimates for piping lengths, pipe diameters, and valve counts to estimate piping-related system changes. Allowances were also included in the estimates in lieu of factored estimating with item counts or specified units. Based on the analysis presented in this article, KNPC selected Case 4 to proceed to the next phase of project development.
Implementation of the recommended system improvements results in a project payout period slightly more than 2 years. The total overall project cost was reduced due to a decision to minimize new tankage.
Acknowledgment
Dean Trierwiler, Donald Alton, and Richard Tan, Haverly Systems Inc., provided a tremendous amount of support on this project. Their knowledge and expertise of the GRMTPS LP software was invaluable in developing the tankage simulation model and reporting structure.
The authors
Ghanim Al-Otaibi is a senior process design engineer for Kuwait National Petroleum Co., Mina Abdulla, Kuwait. He has worked for Kuwait Petroleum for 12 years and has operational experience with the refinery's atmospheric resid desulfurization unit, flare-gas recovery unit, and vacuum resid and aviation throttle kerosine Merox units. Al-Otaibi is also an engineering coordinator with the projects department and conducts process and economic evaluations, licensor selection, hazardous and operability reviews, process reviews, and engineering reviews. He holds a masters in chemical engineering from Kuwait University, Safat.
Michael Stewart ([email protected]) is senior planning consultant for Foster Wheeler NA Corp., Houston. He has 27 years' international experience in plant operations, strategic and operational planning, market planning and analysis, economic evaluations, and management of projects in the oil, refining, and petrochemical industries. He previously worked for 15 years with the Saudi Arabian Oil Co. His recent experience with Foster Wheeler focuses on investment planning activities and studies associated with refinery and petrochemical process plants. Stewart holds a BS in chemical engineering from West Virginia University, Morgantown, and an MBA from Marshall University, Huntington, WVa. He is a registered professional engineer in West Virginia and Texas, and is a member of AIChE, International Society for Measurement and Control, and International Association for Energy Economics.


