New method uses conformable array to map external pipeline corrosion
Al Crouch, Todd Goyen, Patrick Porter
Development and testing have been completed on a method for measuring external corrosion on steel pipelines using a conformable eddy-current array.
The method, developed by Southwest Research Institute, San Antonio, uses a flexible printed circuit board with pairs of sensing coils and electronic components that energize the coils and process their signals.
Software produces a contour map of the corrosion, which identifies the depth and location of the deepest pit and calculates the maximum safe operating pressure.
The US Department of Energy through the National Energy Technology Laboratory funded feasibility testing and design by. Clock Spring Co. LP, Houston, provided cofunding and support.
Defect assessment
Pipeline operators use both external and internal surveys to evaluate the condition of their pipelines. In-line inspection (ILI) tools are a common method to evaluate pipelines and pinpoint damage. ILI surveys can provide information on welds, branch connections, valves, wall thickness changes caused by corrosion, and other imperfections in the pipe.
Once features are identified, bell-hole excavations verify the quality of reported features. While verification serves many purposes, the primary one is accurately to qualify the extent of the features so that defect assessment and repair can ensure pipeline integrity is maintained cost effectively.
Secondary benefits include the recording of feature information for use on subsequent inspections (in pipe calibration pieces).
Defect assessment typically follows one of three industry-accepted methods. The most common is B31G (ASME B31G, Manual for Determining the Remaining Strength of Corroded Pipelines). This assessment technique requires only the length and maximum depth of a corrosion defect that, with pipe material information, can be used to calculate a safe operating pressure for the defect.
While this method is fast and easy, it is often too conservative and can lead to unnecessary repairs.
More-complex assessment methods can be used to minimize unnecessary repairs. Using slightly different material properties and a different shape factor, a modified assessment can be made that is less conservative than the original B31G. This is the 0.85 dt method. It still requires, however, only defect length and maximum depth to calculate a safe operating pressure.
The assessment technique with the least variability is the exact or effective area technique. Instead of assuming a shape factor, this technique uses the exact cross-sectional area of the defect. The area is determined from a complex axial profile that uses the maximum corrosion depth at each axial measurement spacing.
Corrosion measurement
Regardless of which assessment method is used, local measurements on the outside of the pipe in the pipeline excavation (bell hole) usually provide the input data.
The simplest case is that of a single isolated pit. A scale measures the length of the corroded area. A dial extension gauge (pit gauge) is placed over the pit (assuming the base will span the pit) and the maximum depth read and recorded.
Slightly more complicated is the case of several overlapping pits or a small patch of corrosion. In this case, the length can still be read from a scale.
An attachment, such as a bridging bar, often spans the entire defect, providing a reference surface from which to measure depth. Because it is not always possible readily to locate the deepest pit within the grouping from a visual examination, several independent depth measurements must be taken.
When the corrosion is extensive and an exact area assessment is needed, it is essential that the defect be accurately mapped to form a contour plot.
In these cases, a rectangular grid is drawn or painted on the pipe surface, including the corroded area. Depth measurements are taken at each grid intersection.
From this array of measurements, either manual or computer-aided processing constructs a contour map. The contour map is then used to assess the defect and calculate a safe operating pressure.
All these manual methods are laborious, time-consuming, and error prone. It can take the better part of a day to make all the grid measurements on an extensive corrosion patch. Furthermore, the environment of the pipeline bell hole is not always user-friendly.
Rain, cold, and other inconveniences can take a toll on operator attention and, consequently, accuracy of measurement. This is particularly true if the corrosion patch is on the bottom of the pipe.
The eddy-current array, described here, promises a faster and more-reliable method of acquiring contour measurements.
Eddy-current liftoff measurement
Eddy-current liftoff is the method of pit depth measurement used by the conformable array.
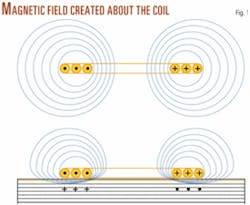
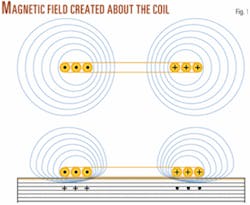
Alternating electrical current flowing in a coil of conductive material (Fig. 1) creates a magnetic field there. If the coil is placed near an electrically conductive material, the magnetic field penetrates the material and causes reaction currents to flow in the material.
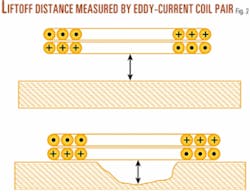
These currents change the electrical impedance of the coil. The amount of change depends on, among other things, the spacing between the coil and the material, as indicated by the arrows in Fig. 2.
If two coils are close to each other, as is the case with the conformable array, and one coil is an "exciter" and the other a "receiver," the electromagnetic coupling between the coils is a function of the distance to the conductive material.
If the coil pair is placed on a smooth surface and then moved over a corroded area, the metal loss at the corrosion represents an increase in the distance from coil pair to conductive material, leading to coil coupling changes that may be detected as a measure of pit depth.
The array used in this development contained numerous coil pairs on a flexible sheet with connections allowing each of them to sense pit depth over the area beneath them.
Eddy-current measurement using alternating current excitation creates reaction currents only in the near surface of the conductive material, the depth of penetration depending on the excitation frequency and the properties of the conductive material.
The conformable array uses a frequency that penetrates much less than 1 mm into the pipeline steel, making the measurement independent of the pipe wall thickness. As a result, the system cannot determine remaining wall thickness without using an assumed nominal wall thickness or by an auxiliary wall measurement in the vicinity of the corrosion.
When these measurements are acquired, they are input to the conformable array analysis software to produce an accurate defect assessment.
Conformable array design
Since eddy-current coils can be fabricated on flexible printed circuit boards, a flexible board was outfitted with multiple eddy-current coil pairs and wrapped over corrosion to produce a rapid mapping of the corrosion, including depth.
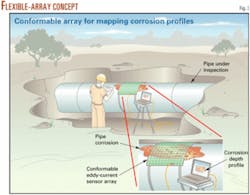
This system offered the potential for a fast, relatively low-cost measurement system, usable with minimal support equipment and minimal training (Fig. 3).
Original experiments with the eddy-current array used a flexible printed circuit array with 64 coil pairs, each one 4 mm in diameter. The engineering prototype board expanded the size to 256 coil pairs, with coil pairs being 9.5 mm apart. Besides the 6-in. square array, the printed circuit board also included rigid portions for mounting circuit components.
The flexible portion of the board was made in seven layers to provide for the intricate interconnections between coils and the interface circuitry at the board's edge. The production version of the array will include a conformal coating over the circuitry boards for environmental protection.
Testing the concept
Technicians conducted two sets of proving tests once the prototype board was built and checked out: The first test was on a natural corrosion specimen at SwRI and the other on a section of pipe with extensive corrosion at the RTD Quality Services Houston facility.
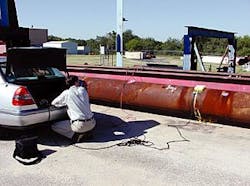
The system was deployed from an automobile trunk for the SwRI test (Fig. 4). In addition to the case containing power supplies and A/D converter, a laptop computer displayed the operating screen and the imaged data from the scan.
The testing at the RTD facility had two advantages over the SwRI test. First, the corrosion patch was large, providing a chance to use the stitching algorithm that created a large color-depth map from several (in this case, eight) separate scanning positions.
Second, the test pipe had previously been scanned by a laser scanner, giving a comparison of performance with the industry "standard of excellence" in accuracy and resolution.
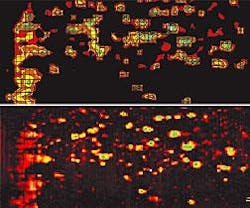
Fig. 5 shows the results of the laser scan and the eddy-current scan. The eddy-current scan (top image) was plotted in Microsoft Excel and the contour colors chosen to match the laser scan (bottom image) colors.
Comparison of these images indicates the laser has a higher resolution, based on the many smaller spotted (red) indications shown between the larger (multicolored) indications. Significant features—those representing least-remaining wall thickness (multicolored indications)—match between the two scans.
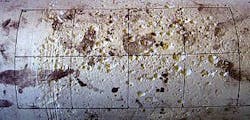
Fig. 6 shows the 12-in. by 24-in. corrosion patch with the eight contiguous 6-in. square measurement areas. Creating a file of baseline data first involved using the array to scan a clean area on the test pipe. The array was then positioned on the large corroded area in eight setups guided by register marks placed on the pipe.
The operating software accepts inputs of the number of setups in the horizontal and vertical directions and prompts the user to move to the next position. Each scan takes only seconds.
The calculations of pit depth are made almost instantly after the data are collected, and the data are written out to a file that may be displayed with graphing software such as Microsoft Excel. Comparison of the plot and the photograph of the corrosion indicate good correlation.
Indeed, when compared to the direct measurement laser scan data for this same corrosion patch, the conformable array showed similar pit depths, shapes, and positions (Fig. 5) with a visible representation accuracy notably greater than that of in-line inspection.
Analysis software, data display
The conformable array software was written with ease of use for both acquisition and analysis in mind, thereby allowing a trained user to scan a pitted corrosion area and make pipeline repair or replacement decisions in minutes rather than days.
Conventional wall-thickness measurements require bulky instruments or imprecise and time-consuming hand measurements. The conformable array software handles both acquisition and analysis in real time.
The operator first acquires data scans of the pipe in the 6-in. square sections; corrosion areas larger than this require multiple scans, with the results being stitched together in software.
These data are then scaled, using known scans from uncorroded pipe wall and air (100% corrosion). The user receives a surface map of calibrated wall loss. Using industry guidelines for interacting pits, the data are "auto-boxed" or, more simply, interacting pits are automatically discovered in software, and groups of such pits are reported to the user.
Initial versions of the software reported only two defect groups, the largest axial length group and the deepest pit group; however, early tests showed that this method would fail to report the correct group when a group displayed a combination of features. New versions of the software default to the group with the lowest maximum allowable operating pressure.
If the operator has entered the pipeline parameters, then B31G, modified B31G, and effective area calculations are performed and displayed in real time. If a pipeline appears to be operating outside of allowed specification or a new maximum operating pressure has been determined, then a warning is issued to the user and the pipeline operator can take the appropriate preventive measures.
A future version of the code may also interface with an ultrasonic transducer to check the actual wall thickness and GPS transceiver to record a corrosion patch location.
ILI tool validation
In addition to assessing corrosion defects, ILI tool performance must be validated. ILI technology has matured to the point where tools can now report feature geometry information.
These tools also report thousands or even tens of thousands of features. The inspection report now forms the foundation for an integrity management plan. This requires that the ILI data be confirmed and the ILI report validated.
This requires accurately mapping defects for comparison to the reported feature geometry. The conformable array can perform this secondary task with no additional labor. The electronic file can be stored for record keeping and reviewed on subsequent inspections to validate tool performance.
It was a design goal of the conformable array system that the system relieve the operator of making any manual calculations of safe operating pressure; therefore, the system software performs the assessment calculations automatically.
Individual pits are tested for proximity to all surrounding pits to determine interaction. The system then performs a "boxing" function to place pits critical to the pipe safe operation within a calculation box.
The eddy-current data are converted to pit depths by using a conversion curve. Since the spacing between coil pairs is fixed and known, X-Y dimensions can also be determined. The depth and profile data are applied to B31G and other assessment algorithms and the results displayed on the laptop screen.
These calculations require manually input pipe parameters prior to the calculation.
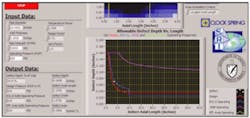
In addition to the numerical data, graphs of acceptable combinations of defect depth and length are displayed with a single dot identifying the local corrosion parameters. Fig. 7 shows a sample of the type of data presented.
Plans
Testing of the conformable array system yielded very encouraging results. The RTD test compared very favorably with the earlier laser scans of the same feature. The system was found easy to use and much faster than manual methods.
Design of an improved commercial system is currently under way. Scanning speed will be increased, perhaps even to video levels.
The digitizing function will be combined with the other electronics on the board, doing away with the external power supplies and A/D converters.
The only components will be the flexible board and a generic laptop computer. Both power and communication will be provided through the USB port of the laptop.
The authors
Alfred E. Crouch is a staff engineer in the Applied Physics Division of Southwest Research Institute in San Antonio, where he has managed pipeline integrity projects for clients such as the Gas Research Institute, the US Department of Energy, and US Department of Transportation. Crouch is a graduate of Rice University, a professional engineer in Texas. He is a Fellow of the American Society for Nondestructive Testing.
Todd Goyen is a research scientist in the Applied Physics Division of Southwest Research Institute, San Antonio, where his work involves a wide range of projects involving electromagnetics. He is also contributing to the enhancement of a major software package for data acquisition, analysis, and display. Goyen developed a high-performance laser stabilization system while working at the Max Born Institute in Germany. He holds a degree in physics from the University of Texas at Austin
Patrick Porter is manager of technology for Clock Spring Company LP, Houston. Prior to joining Clock Spring, he held senior positions with in-line inspection service providers. In this capacity, Porter was responsible for development, design, and operation of high-resolution magnetic flux leakage inspection tools. He holds patents on various inspection technologies.
Correction
The article "Rigid-PU coating addresses chronic corrosion on northern Chinese gas pipeline" (Oct. 4, 2004, p. 58) failed to note its previous venue: The article was based on a presentation to the 6th International Conference on Pipeline Rehabilitation & Maintenance, Oct. 7-9, 2003, Berlin.
