Analyses of incident data show US, European pipelines becoming safer
Analyses of pipeline-incident data for Europe and the US over 30 years confirm that systems in both regions have become increasingly safer.
Pipeline-incident data were gathered over a long period by the European Gas Pipeline Incident Data Group (EGIG), CONCAWE (Western-European cross-country oil pipelines), and the US Department of Transportation's Office of Pipeline Safety, Research and Special Programs Administration. (DOT/OPS/ RSPA covers both oil and gas pipeline systems in the US.)
The main goal in gathering this information was to demonstrate and, if possible, improve the safety performance of pipeline transmission systems.
Information on loss-of-containment incidents of European and US oil and gas pipeline transmission systems, as published by these organizations, was analyzed and is summarized in this article. Loss-of-containment incidents of onshore steel pipeline transmission systems are presented here.
Although it is difficult to compare directly among the different databases (the definition of an incident, for example, not being uniquely defined), such a comparison leads to some general conclusions.
European gas pipelines
Pipeline incident data of onshore European natural gas transmission systems, covering 1970-2001, have been collected and analyzed by EGIG in its fifth report (Doc. No. EGIG 02.R.0058, December 20021). All incidents with an unintentional gas release from these pipelines, which have a design pressure greater than 15 barg (217 psig), are reported for outside-fence installations only. (Associated equipment such as valve stations and compressors are excluded from the database.)
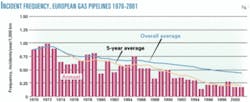
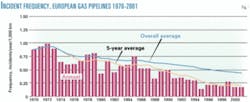
A total of 1,060 incidents comprise the EGIG database, representing total exposure of 2.4 million km-years. The overall incident frequency for 1970-2001 of European gas pipelines averages 0.44 incidents/year/1,000 km. Over this 32-year period, the 5-year average incident frequency improved considerably from 0.86 incidents/year/ 1,000 km (1970-74) to 0.21 incidents/ year/1,000 km (1997-2001; Fig. 1).
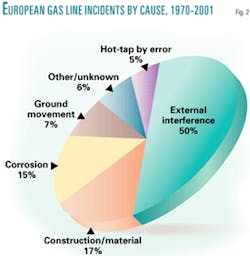
External interference (digging with excavators, ground works carried out with drainage machines and plows) is by far the largest cause of incidents, accounting for almost 50% of all incidents reported in the EGIG database (Fig. 2.
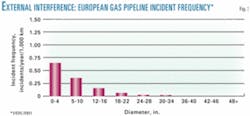
Smaller pipelines show a higher incident frequency, especially for external interference, because they are more easily damaged because of smaller wall thicknesses and lower material grade on average when compared with larger pipelines.
Fig. 3 presents the external interference incident frequency for different diameter classes. Pipelines having a cover depth of less than 1 m or built in suburban areas are more susceptible to external interference compared with pipelines having a greater cover depth and constructed in rural areas.
Western European oil pipelines
Performance data of Western-European cross-country oil pipelines have been collected and analyzed by CONCAWE covering 1971-2000.2 Annual reports published by CONCAWE provide detailed information and analysis of incidents of the reported year as well as a 5-year comparison.
Incident data of 2001, published February 2003, have been included in this analysis.3 All spills of 1 cu m or more of European onshore cross-country pipelines in the public domain (at least 2 km long) transporting oil, crude oil, or petroleum products are included in the CONCAWE database.
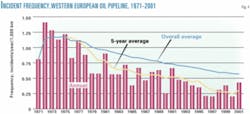
A total of 394 incidents comprise the CONCAWE database, with total exposure of 700,000 km-years. The overall incident frequency for 1971-2001 of European oil pipelines averages 0.56 incidents/year/1,000 km. Over this 31-year period, the 5-year average incident frequency improved considerably from 1.17 incidents/year/1,000 km (1971-75) to 0.30 incidents/year/ 1,000 km (1997-2001; Fig. 4).
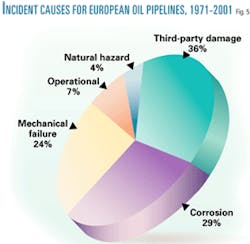
The three most important causes of spills for oil pipelines are third-party damages (36% of all incidents), corrosion (29% of all incidents), and mechanical failure (2% of all incidents). Other causes, such as operational (7%) and natural hazards (4%), only make minor contributions (Fig. 5).
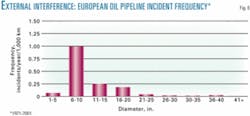
The third-party damages (external interference) frequency for pipelines in the range of 6 in. up to and including 10 in. (almost 1.0 incidents/year/ 1,000 km) is considerably higher compared with all other diameter classes (fewer than 0.25 incidents/year/1,000 km; Fig. 6).
A total of 14 fatalities and 2 injuries have been reported 1971-2001. The probability of an injury or fatality therefore amounts to: 2.3.3.10–5/year/ km (injury 0.3 X 310–5/year/km, fatality 2.0 X 10⁻⁵/year/km).
US gas pipelines
Pipeline incident data of US natural gas transmission systems, covering 1986-2002, have been gathered by the US DOT's Office of Pipeline Safety. Statistics of both onshore and offshore transmission and gathering pipelines, including compressor and regulator or metering systems, are reported. Data used for this analysis have been obtained from http:// ops.dot.gov/stats.htm.
All incidents involving a release of gas and either:
1. A death or personal injury necessitating in-patient hospitalization; or,
2. Estimated property damage of $50,000 or more.
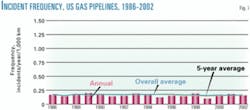
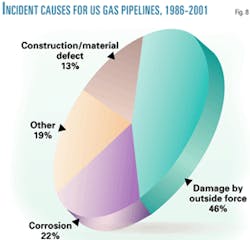
The overall incident frequency of US gas pipelines (onshore and offshore transmission and gathering) for 1986-2002 averages 0.15 incidents/year/1,000 km. This figure would be reduced to 0.11 incidents/year/1,000 km, considering onshore pipeline incidents only (not taking into account compressor and regulator or metering system incidents, as adopted by EGIG for the European gas pipeline database).
The 5-year average incident frequency of US gas pipelines (onshore and offshore transmission and gathering) hardly changed over the 17 years 1986-2002 and amounts to 0.15 incidents/year/1,000 km (1998-2002) when compared with an incident frequency of 0.17 incidents/year/1,000 km (1986-90; Fig. 7).
A total of 59 fatalities and 224 injuries are reported for 1986-2002. The probability of an injury or fatality, therefore, amounts to: 3.2 X10⁻⁵/ year/km (injury 2.5 X10⁻⁵/year/km, fatality 0.7 X10⁻⁵/year/km).
Property damage for 1986-2002 amounts to $325 million in total, equivalent to an average of $237,000/ incident.
The incident frequency of US gas pipelines is considerably lower than for European gas pipelines, which can be explained by the redefinition of an incident in 1984. Since then, only incidents with a property damage of $50,000 or more are reported in the US, whereas all incidents with an unintentional gas release are reported in Europe.
Redefinition of an incident during 1984 introduced a threshold value for damages occurred. Comparing incident data of US gas pipelines over a 5-year period before and after the transition year 1984 shows that at least five times more incidents were reported before 1984, not applying a threshold value for damages (incident frequency of 0.90 incidents/year/1,000 km for the period 1979-83 and 0.18 incidents/ year/1,000 km for the period 1985-89).
US liquid pipelines
OPS has collected pipeline incident data of American oil pipelines, covering 1986-2002 and including statistics of both onshore and offshore oil pipelines, including pump stations and tank farms. Data used for the analysis have been obtained from http://ops.dot .gov/stats.htm.
A reportable accident for hazardous liquids is:
1. An explosion or fire not intentionally set by the operator.
2. Loss of 50 or more bbl of product (8 cu m or more).
3. Escape to the atmosphere of more than 5 b/d of highly volatile liquids (1 cu m/day or more).
4. Death or bodily harm to any person.
5. Estimated property damage exceeding $50,000.
The reporting criteria changed in 2002, adding small spills down to 5 gal. The change was instituted on Feb. 7, 2002. For continuity with past trending, data from accidents after that date and used in the OPS statistical summary include only accidents meeting the above-mentioned reporting criteria.
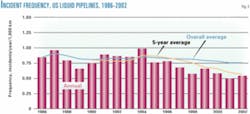
The overall incident frequency for 1986-2002 is 0.75 incidents/year/ 1,000 km. This figure would reduce to 0.48 incidents/year/1,000 km, considering only the incidents directly related to pipelines. The 5-year average incident frequency slightly improved over the 17-year period from 0.80 incidents/year/1,000 km to 0.58 incidents/year/1,000 km (1998-2002; Fig. 9).
A total of 37 fatalities and 249 injuries are reported for 1986-2002. The probability of an injury or fatality, therefore, amounts to
.8 X10–5/year/ km (injury 5.9 X10⁻⁵/year/km, fatality 0.9.3.10–2/year/km).
The average gross spillage volume over 1986-2002 amounts to 145 cu m/spill (equivalent to 109 cu m/1,000 km). Property damage amounts to $819 million, equivalent to an average of $258,000/incident for 1986-2002 (equivalent to $1,770/cu m).
Out of the 1,929 onshore pipeline incidents, 74 resulted in a fire (3.8% of the incidents), 2 in an explosion only (0.1% of the incidents) and 26 in an explosion/fire (1.4% of the incidents).
Statistical comparison
Table 1 summarizes incident frequencies of European and US gas transmission pipelines and oil transportation systems for different periods.
Figures in parentheses in Table 1 for US transmission pipelines indicate the estimated incident frequency for all pipeline incidents with a loss of containment, neglecting compressor station, metering or regulating, pump station and tank farm incidents. This is then in line with the European incident definition enabling a comparison between European and US incident statistics.
Figures in parentheses in Table 1 for European oil transportation systems indicate the calculated incident frequency considering spills of 50 bbl or larger in line with the American definition of an incident.
Adopting the EGIG incident definition on incident information for US gas pipelines shows that the incident frequency for US gas pipelines was comparable to the European incident frequency initially (1981-90 compared with 1986-95) and hardly changed thereafter. The European incident frequency improved considerably (by 57% comparing 1981-90 with 1992-2001).
Adopting the CONCAWE incident definition on incident information for US oil pipelines and considering spills larger than 50 bbl only make clear that the incident frequency for US oil pipelines slightly improved (by 17% comparing 1986-95 with 1992-2001).
The European incident frequency for oil pipelines over the same period fell by 32%. The incident frequency over the last period, both the 5-year and 10-year average, is significantly lower.
It is important to report all damages, not only incidents with a loss of containment also having restrictions in size and (or) property damages (for example, incidents of US oil pipelines are only reported that have more than 50 bbl of product loss and a property damage exceeding $50,000), but also the so-called "near misses."
Reporting near misses provides more-detailed information on causes of incidents, which can be utilized for accident prevention.
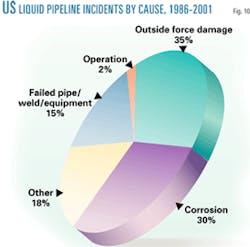
According to information from EGIG, CONCAWE, and OPS, external interference (third-party activity) is the main cause of pipeline incidents. The external interference incident frequency depends to a large extent on pipeline diameter, wall thickness, depth of cover, use of damage prevention measures, and location (rural or suburban areas).
Risk assessments on pipelines should consider the influence of these parameters on the incident frequency. Predictive failure models, which can be used to estimate the incident frequency of an existing or proposed pipeline, have been developed for this purpose.6
It should be ensured, however, that statistically justified data have been used in developing a reliable model with sufficient reproducibility. Other models not only consider the failure frequency, cause, and mode but also the gas outflow, dispersion, ignition, and thermal effects.
An analysis for the Dutch gas transmission system by Gasunie found significant influence of depth of cover and location or population density (suburban or rural) on damage frequency (also considering dents and gouges without loss of containment).7
Increasing the depth of cover from 1 m to 2 m reduces the damage frequency (hit frequency) by a factor 10 in rural areas and by a factor 3.5 in suburban areas. Also use of concrete barriers above a pipeline reduces the damage frequency considerably (by a factor 5) and in combination with a warning tape even by a factor 30, according to field trials carried out by British Gas (now BG Transco).8
Understanding the causes of incidents enables operators to focus their efforts on main risks. Applying the correct risk-mitigation measures makes it is possible to improve the safety performance of pipelines at reasonable costs.
This requires detailed information being made available and exchange of experiences by different operators. This is made possible by organizations like EGIG, CONCAWE, and government entities such as OPS. This requires, however, a uniform incident definition making it possible to conduct detailed comparisons between different countries. Data being utilised for analysis should be based on sufficient relevant experience (i.e., exposure expressed in km-year).
References
1. 5th EGIG-report 1970-2001 Gas pipeline incidents, Doc. Number: EGIG 02.R.0058, 5th Report of the European Gas Pipeline Incident Data Group (EGIG), December 2002.
2. Western European cross-country oil pipelines 30-year performance statistics, CONCAWE Report No. 1/02, February 2002.
3. Performance of European cross-country oil pipelines, Statistical summary of reported spillages—2001, CONCAWE Report No. 1/03, February 2003.
4. US Department of Transportation: http://ops.dot.gov/stats.htm
5. Pipeline incident frequencies and causes for European and US Oil & Gas transmission systems, prepared by Wim Guijt, Tebodin Consultants & Engineers for NEN, Nederlands Normalisatie Instituut, document No. 26335-50 71,0001, Mar. 4, 2002.
6. An assessment of measures in use for gas pipelines to mitigate against damage caused by third-party activity, prepared by W.S. Atkins Consultants Ltd. for the Health and Safety Executive, Contract Research Report 372/2001.
7. The Influence of Land Use and Depth of Cover on Failure Rate of Gas Transmission Pipelines, by Eric Jager, Robert Kuik, Jeroen Zanting (Gasunie Research), and Gerard Stallenberg (Gasunie Transport Services), proceedings of IPC 2002, International Pipeline Conference Sept. 29–Oct. 3, 2002, Calgary.
8. The Application of Risk Techniques to the Design and Operation of Pipelines, I. Corder BSc, British Gas, C502/016/95.
The author
Wim Guijt is project manager and pipeline consultant for international oil and gas projects for Tebodin Consultants & Engineers, The Hague. He has more than 15 years' experience in engineering and project management of oil and gas projects (pipelines as well as facilities), ranging from feasibility studies, basic and detailed design, and also construction supervision. Guijt holds an MSc in civil engineering, with a major in offshore technology from Delft University of Technology, the Netherlands.
